AAR2 - Second Austrian Assessment Report on Climate Change
Austrian Panel on Climate Change | APCC | 2025

Second Austrian Assessment Report on Climate Change | AAR2
This publication was subject to an anonymous international peer review process guided by several review editors, the AAR2 co-chairs and the APCC Steering Committee.
The views or opinions expressed in this publication are not necessarily those of the institutions with whose support this work was carried out. The publisher and the supporting institutions do not guarantee the accuracy or continued availability of urls to external websites or third-party websites mentioned in this publication and accept no responsibility for the accuracy or appropriateness of any content contained therein.
Recommended citation
APCC (2025): “Second Austrian Assessment Report on Climate Change (AAR2) of the Austrian Panel on Climate Change (APCC)”. [D. Huppmann, M. Keiler, K. Riahi, H. Rieder (eds.)]. Austrian Academy of Sciences Press, Vienna, Austria | doi: doi.org/10.1553/aar2
You can download the recommended citation in the formats Endnote (.ris) and BibTex (.bib) at aar2.ccca.ac.at/citation.
Vienna, June 2025 ISBN: 978-3-7001-5110-4 | austriaca.at/5110-4 (full report)
Production
Publisher: Austrian Academy of Sciences Press, Vienna
Typesetting: Crossdesign Werbeagentur GmbH, Graz
Cover: paulaidaanton | Agentur für digiloges Design
Graphic design: CCBox 1 Figure 1, CCBox 1 Figure 2, CCBox 1 Figure 3, Table 2.2, Figure 3.2, Figure 4.1, CCBox 6 Figure 1, Figure 5.3, Figure 5.6, Table 6.2, Figure 7.3, Figure 8.4, Figure 8.5: paulaidaanton | Agentur für digiloges Design
AI-based tools such as DeepL were used to support the linguistic revision.
Contact address for product safety: Austrian Academy of Sciences Press Dr. Ignaz Seipel-Platz 2 A-1010 Wien Tel.: +43-1-51581-3420 E-Mail: verlag@oeaw.ac.at
Funding acknowledgement
The AAR2 was funded by the Climate and Energy Fund under the 14th Austrian Climate Research Program (ACRP).
Copyright and license
© 2025 Austrian Panel on Climate Change (APCC) This report is published under a Creative Commons CC-BY 4.0-License. creativecommons.org/licenses/by/4.0

Text of the graphic
Coordination
Support
Publisher
The AAR2 is a report by the Austrian Panel on Climate Change (APCC).

200 Wissenschaftler:innen. 100 externe Gutachter:innen. 3 Jahre intensive Arbeit. Zahllose Daten und Analysen. Das Ergebnis davon halten wir nun in Händen: den Zweiten Österreichischen Sachstandsbericht zum Klimawandel. Es ist ein Blick in den Spiegel, ein Realitycheck, der uns zeigt, wie sich die Klimakrise in den letzten Jahren beschleunigt hat – global und hier in Österreich. Hitzewellen, Dürren und Hochwässer sind Realität geworden, und das mit gravierenden Folgen für Gesundheit, Wohlstand und Wirtschaft.
Eine gute Nachricht gibt es, und zwar dass die heimischen Treibhausgas-Emissionen auf einem historischen Tiefstand sind. Großartig! Aber wie so oft bei guten Nachrichten hat auch diese einen Haken, nämlich sind wir – fast schon typisch gemütlich Österreichisch – ein bisschen spät dran, was unsere Emissionsreduktion betrifft. Wollen wir bis 2040 klimaneutral sein, müssen wir nicht nur vieles ändern, sondern vieles rasch ändern. In der Energieversorgung, Mobilität, Ernährung und mehr. Das ist natürlich nicht einfach. Und es kostet! Aber der Bericht macht klar: Nichts zu tun kostet uns noch viel mehr. Und damit meine ich gar nicht Geld, sondern etwas viel Wertvolleres: unsere Zukunft. Klimaschutz lohnt sich allemal – ökologisch, sozial und wirtschaftlich. Entscheidend ist, dass wir ihn nicht isoliert von allem rundherum betrachten, sondern Biodiversität, Energieunabhängigkeit und vor allem auch soziale Gerechtigkeit einbeziehen. Denn die Klimakrise trifft sozial Schwächere am stärksten.
Dieser Sachstandsbericht ist aber nicht nur ein Weckruf, der uns zeigt, wo wir stehen. Sondern zugleich auch eine Anregung, die uns den Weg in eine nachhaltige Zukunft zeigt. Die Klimakrise ist real, die allermeisten Menschen wissen das. Sie fordern mehr Mut, mehr Taten – und ich schließe mich da an. Ich bin sicher, dieser Bericht ist dazu ein geeigneter Anstoß.


Mit dem Zweiten Österreichischen Sachstandsbericht zum Klimawandel liegt nach nun dreijähriger interdisziplinärer Forschungsarbeit eine der fundiertesten und umfassendsten Analysen der Klimawandelfolgen sowie der möglichen Handlungsoptionen für Österreich vor. Dafür möchte ich mich bei den rund 200 beteiligten Expertinnen und Experten herzlich bedanken.
Die Ergebnisse zeigen die Herausforderungen in aller Deutlichkeit. In Österreich sind die Folgen des Klimawandels besonders spürbar. Unser Land erhitzt sich stärker als der globale Durchschnitt. Die Folgen zeigen sich längst in allen Lebens- und Wirtschaftsbereichen – von Land- und Forstwirtschaft und Gesundheit bis hin zu Infrastruktur, Tourismus und Ökosystemen.
2024 war das wärmste Jahr der Messgeschichte mit belastenden Hitzeperioden und schweren Überflutungen. Mit fortschreitendem Klimawandel verstärken sich diese Extreme und deren Auswirkungen. Angesichts dessen braucht es ambitionierte Maßnahmen mit gezielten Investitionen und ein abgestimmtes Vorgehen beim Klimaschutz und der Anpassung an den Klimawandel – quer durch alle Sektoren. Wir müssen sicherstellen, dass unsere Energieversorgung, Mobilität, Wärmebereitstellung, Industrie sowie Land- und Forstwirtschaft zukunftsfähig ausgestaltet sind und dabei gleichzeitig unsere Wirtschaft und unser Standort gestärkt aus der Transformation hervorgehen.
Wenn wir es richtig angehen, können Investitionen in Klimaschutz und Anpassung positive Auswirkungen auf Beschäftigung, Einkommen und Wohlstand haben und die Abhängigkeit von Energieimporten sowie Folgekosten verringern. Das Ziel der Klimaneutralität ist im Regierungsprogramm verankert. Wir arbeiten auf Hochtouren an einem Klimagesetz, um damit den Rahmen für abgestimmtes Handeln zu setzen. Der Sachstandsbericht zeigt eindrücklich, dass wir rasch und entschlossen handeln müssen – als Gesellschaft, als Politik, als Einzelne. Gemeinsam können wir unsere Natur, Wirtschaft und unser Leben resilienter und nachhaltiger machen – darauf kommt es jetzt an. Ich bin davon überzeugt, dass wir unsere Klimaziele erreichen können, wenn wir gemeinsam an Lösungen arbeiten, die ökonomisch sinnvoll und umsetzbar sowie sozial tragfähig sind.

TABLE OF CONTENTS
AAR2 PREFACE
Daniel Huppmann, Margreth Keiler, Keywan Riahi, Harald Rieder
The effects of climate change can already be observed in Austria – it is reshaping life and landscapes in Austria. Detectable changes include extended dry periods, increasing frequency of heatwaves and floods, and retreating glaciers, which are consistent with global trends in a warming world. These impacts, driven by anthropogenic greenhouse gas emissions, have become more frequent, intense, and widespread, with increasing risks for natural systems, the economy, public health, and infrastructure. The regional manifestation of these changes in alpine as well as lowland areas demands targeted responses from all parts of society.
At the same time, Austria has committed itself to ambitious climate goals at the national, European, and international level. These include the Austrian target of climate neutrality by 2040, the legally binding European Climate Law (greenhouse gas neutrality by 2050), and Austria’s contribution to the Paris Agreement of limiting global warming to well below 2 °C. Emission reductions observed since 2022 indicate a shift of the long-term trend, but the country’s per capita and consumption-based emissions remain high and significantly above the EU average.
Aim and scope
The Second Austrian Assessment Report on Climate Change (AAR2) provides a systematic and comprehensive assessment of the scientific literature on climate change for Austria across all relevant scientific domains. It builds upon the First Austrian Assessment Report on Climate Change published in 2014 and a series of subsequent Special Reports published by the Austrian Panel on Climate Change (APCC) under the auspices of the Climate Change Centre Austria (CCCA).
The objective of the AAR2 is to inform an evidence-based societal transformation by assessing the physical, ecological, economic, and social implications of climate change in Austria. More than 200 scientists collaborated to produce this report. It offers a science-based foundation for policymakers and public dialogue on the portfolio of options for emissions reduction and adaptation. The assessment does not advocate for specific policy instruments but highlights the risks, opportunities, barriers, trade-offs and synergies of alternative climate-friendly transformation pathways. This includes interactions with sustainable development and societal well-being, notably the Sustainable Development Goals (SDGs).
Structure of the report
The AAR2 combines insights from various scientific perspectives including natural sciences, engineering, social sciences, economics, law, and public health. This integration is essential for assessing the multi-faceted challenges related to climate change. It reflects Austria’s diverse institutional, ecological, and socio-economic contexts and strengthens the report’s systemic and interdisciplinary perspective.
The report consists of eight chapters.
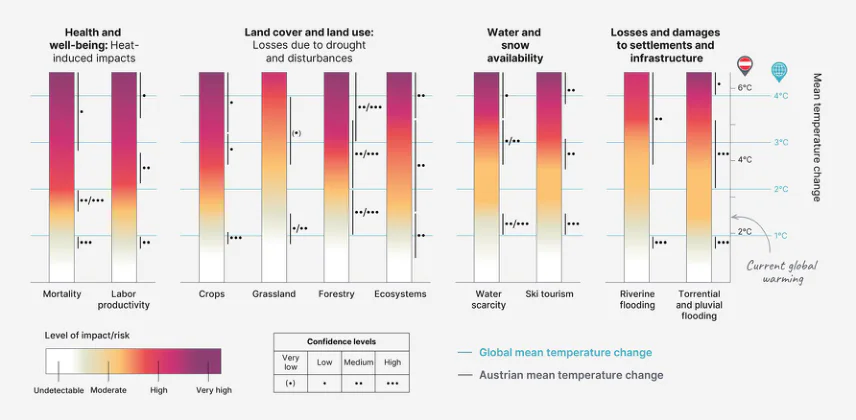
Chapter 1 provides an overview of past, current, and projected changes in Austria’s climate system. Key climate indicators are analyzed across the atmosphere, cryosphere, hydrosphere, biosphere, and lithosphere. A Cross-Chapter Box on Risk introduces the IPCC risk framework and identifying key climate-related risks and their evolution with rising global warming levels (GWLs).
Chapter 2 assesses the impacts of climate change on land use, ecosystem services, and human health with a focus on climate-sensitive sectors such as agriculture and forestry. The chapter explores both domestic and international supply chains and identifies co-benefits from nature-based solutions. Mitigation in land systems focuses on sustainable consumption and ecosystem-based carbon sinks.
Chapter 3 focuses on the systems that structure Austria’s built environment, including settlements, spatial planning, buildings, and transport. It examines how urban form, infrastructure, and mobility systems influence emissions, energy demand, and climate risks. Mitigation strategies include compact development, electrification of heating and transport, and promotion of low-carbon mobility. Adaptation priorities include resilient infrastructure, urban heat mitigation, and inclusive spatial planning.
Chapter 4 focuses on the provision of goods and services in a climate-resilient economy with emphasis on material provisioning, energy systems, and labor. The chapter includes a Cross-Chapter Box on the Avoid–Shift–Improve (ASI) framework. Mitigation in provisioning systems relies on decarbonization of energy and industry, circular economy principles, and sufficiency-oriented approaches. Adaptation focuses on reducing systemic vulnerability through diversification of supply chains, strengthening infrastructure resilience, and building institutional capacity.
Chapter 5 investigates the demand-side transformations necessary to achieve net zero through human decisions and behavior, with particular emphasis on how household consumption, social norms, and lifestyles contribute to greenhouse gas emissions and climate vulnerability. It also assesses inequality, collective action, and the enabling role of institutions, education, and civil society.
Chapter 6 reviews the legal, political, economic, and societal frameworks for climate governance in Austria. The analysis covers policy instruments, just transition mechanisms and financing needs as well as governance challenges and capacity gaps.
Chapter 7 focuses on the Alps as an area of particular relevance for Austria. The Alps are examined on three levels: As a natural or near-natural environment, as a provider of services, goods and livelihoods, and as a home to communities. The chapter highlights climate-related impacts and adaptation needs with an integrated environmental and socio-economic perspective.
Chapter 8 synthesizes knowledge on transformation pathways toward climate neutrality. It presents integrated scenario assessments of emissions, energy demand, carbon budgets, and adaptation to examine the feasibility of different pathways from a biophysical, economic, and socio-cultural perspective.
Assessment approach and methodological frameworks
The assessment follows the procedures and methods established by the Intergovernmental Panel on Climate Change (IPCC). Key findings are formulated with a level of confidence as assessed by the author team and using the calibrated language of the IPCC to indicate the strength of the scientific evidence and level of agreement in the literature. In situations where available evidence and region-specific published literature was limited or insufficient for a reliable assessment, the authors assessed evidence from other regions if the insights were transferable and relevant for Austria.
The IPCC’s further procedures and methods were adapted for the AAR2, and the various approaches and methodological frameworks applied in the AAR2 are discussed in cross-chapter and chapter boxes throughout the report.
This assessment evaluates climate-related risks related to climate change following the IPCC risk concept, which considers the interaction of hazard, exposure, and vulnerability {Cross-Chapter Box 1}. This enables a differentiated understanding of how and why risks emerge and escalate. The report identifies the most relevant key risks for Austria and discusses options to increase climate resilience, acknowledging limits of adaptation.
The risks related to climate change depend directly on the speed of global temperature increase and the implied changes on climatic conditions in Austria. Rather than describing the climatic conditions in a particular set of years (2030, 2040, 2050), the report evaluates impacts from climate change when certain thresholds of global temperatures are crossed (1.5°C, 2°C, 3°C, 4°C), the so-called Global Warming Levels (GWL). This approach reflects the physical basis of climate change and aligns with international policy targets. It enables the identification of climate tipping points, changes in the level of risk, and the effectiveness of adaptive responses at different warming levels. GWLs also allow integration across sectors and scales and ensure policy relevance under conditions of timing uncertainty {Box 1.1}.
The report explores both demand-side and supply-side options to reduce greenhouse gas emissions, including changes to the provisioning systems. It is generally preferable to prioritize (1) the avoidance of climate-harmful activities, (2) the shift toward sustainable alternatives, and (3) the improvement of efficiency in existing systems. This is known as the Avoid-Shift-Improve (ASI) framework {Cross-Chapter Box 4}. Wherever possible, this report presents an assessment of options that follows the avoid-shift-improve rationale.
Not all sectors will be able to reach carbon-neutrality within the timeframes currently discussed by policymakers. As a complementary measure to ambitious mitigation, Carbon Dioxide Removal (CDR) can help balance residual emissions in hard-to-abate sectors. The portfolio comprises nature-based solutions (e.g., increasing natural sinks through afforestation) and technical approaches, but CDR is constrained by costs, land-use conflicts, and limited social acceptance {Cross-Chapter Box 6}.
The transformation of the Austrian society towards climate resilience will require substantial changes to the economy, reducing emissions and resource use while ensuring sufficient resources for well-being of every person living in Austria. Two related concepts to reduce resource-intensity of goods and services are the notion of a circular economy (maximize re-use of resources, minimize waste) {Cross-Chapter Box 5} and a sharing economy (moving from ownership of goods to use-as-a-service) {Section 5.5}. In addition, there is an ongoing debate whether continued economic growth is a prerequisite to support the transition or whether a deliberate focus on reducing material consumption is a more effective strategy to ensuring adequate living conditions for every person living in Austria {Cross-Chapter Box 7}.
Further overarching topics across the AAR2 are health and climate change {Cross-Chapter Box 2}, the needs orientation in provisioning systems {Cross-Chapter Box 3}, and green finance, i.e. the redirection of investments to facilitate transformations while ensuring growth and competitiveness and societal well-being {Cross-Chapter Box 8}.
The report draws on a range of quantitative analysis and model-based scenarios to explore plausible futures for Austria under different emissions trajectories. This allows to understand the feasibility, costs, and trade-offs of various climate policy options in the energy system, industry, transportation, and land use. It illustrates the broad range of policy choices towards a climate-resilient society that are available to policymakers and society while navigating the transformation to climate neutrality.
Acknowledgement
We express our deepest gratitude for the contribution and commitment of the entire author team. We appreciate the dedication and hard work of the Technical Support Unit and Chapter Scientists who supported the chapters and cross-chapter teams in the development of the report. We are grateful for the commitment and diligence of the Review Editors, which were critical in assisting the author teams and ensuring the integrity of the review process. We would also like to thank all the expert reviewers who submitted comments on the drafts to ensure that the final report meets the highest levels of scientific rigor and quality, and we are indebted to all the stakeholders that participated in multiple workshops to help developing a scientific assessment that is hopefully useful and usable for decisionmakers at all levels of society.
The Steering Committee of the Austrian Panel on Climate Change (APCC) and the Climate Change Centre Austria (CCCA) have been instrumental for guiding the AAR2 from the initial scoping phase to its publication over a period of more than five years. We acknowledge the funding and the support from the Climate and Energy Fund throughout the entire process that facilitated the development of the report. We thank the production team including translation, layout, graphic design, website development and public relations, which did an amazing job under tight deadlines. Last, but not least, we appreciate the support of all universities, institutes and research organizations that facilitated the contribution of the authors and thereby enabled this report as an accomplishment of the Austrian climate science community.
A call to action
The report highlights that achieving climate neutrality by 2040 requires urgent action across all parts of society – supported by science-based planning and governance, effective climate policy, and broad engagement with civil society. The AAR2 aims to support this transformation by providing a shared knowledge base for public debate, institutional reform, and cross-sectoral cooperation. We hope that this assessment report provides relevant input for effective climate action.
SUMMARIES
The Summary for Policymakers (SPM) is available at the following links: https://aar2.ccca.ac.at/summary (in English) and https://aar2.ccca.ac.at/zusammenfassung (in German).
The Technical Summary (TS) is available at the following links https://aar2.ccca.ac.at/technical-summary (in English) and https://aar2.ccca.ac.at/wissenschaftliche-zusammenfassung (in German).
Text of the graphic
Second Austrian Assessment Report on Climate Change | AAR2 Austrian Panel on Climate Change | APCC | 2025
Chapter 1 Physical and ecological manifestation of climate change in Austria
Second Austrian Assessment Report on Climate Change | AAR2
Chapter 1 Physical and ecological manifestation of climate change in Austria
This publication was subject to an anonymous international peer review process guided by several review editors, the AAR2 co-chairs and the APCC Steering Committee.
The views or opinions expressed in this publication are not necessarily those of the institutions with whose support this work was carried out. The publisher and the supporting institutions do not guarantee the accuracy or continued availability of urls to external websites or third-party websites mentioned in this publication and accept no responsibility for the accuracy or appropriateness of any content contained therein.
Recommended citation
H. Formayer, J. Parajka, J.S. Petermann, et al. (2025): Physical and ecological manifestation of climate change in Austria. In “Second Austrian Assessment Report on Climate Change (AAR2) of the Austrian Panel on Climate Change (APCC)”. [D. Huppmann, M. Keiler, K. Riahi, H. Rieder (eds.)]. Austrian Academy of Sciences Press, Vienna, Austria | doi: doi.org/10.1553/aar2-ch1
You can download the recommended citation in the formats Endnote (.ris) and BibTex (.bib) at aar2.ccca.ac.at/citation.
Vienna, June 2025 ISBN: 978-3-7001-5110-4 | austriaca.at/5110-4 (full report)
Production
Publisher: Austrian Academy of Sciences Press, Vienna
Typesetting: Crossdesign Werbeagentur GmbH, Graz
Cover: paulaidaanton | Agentur für digiloges Design
Graphic design CCBox 1 Figure 1, CCBox 1 Figure 2, CCBox 1 Figure 3: paulaidaanton | Agentur für digiloges Design
AI-based tools such as DeepL were used to support the linguistic revision.
Contact address for product safety: Austrian Academy of Sciences Press Dr. Ignaz Seipel-Platz 2 A-1010 Wien Tel.: +43-1-51581-3420 E-Mail: verlag@oeaw.ac.at
Funding acknowledgement
The AAR2 was funded by the Climate and Energy Fund under the 14th Austrian Climate Research Program (ACRP).
Copyright and license
© 2025 Austrian Panel on Climate Change (APCC) This report is published under a Creative Commons CC-BY 4.0-License. creativecommons.org/licenses/by/4.0

Text of the graphic
Coordination
Support
Publisher
The AAR2 is a report by the Austrian Panel on Climate Change (APCC).
Coordinating Lead Authors
| Herbert Formayer | BOKU University |
| Juraj Parajka | Technical University Vienna | TU Wien |
| Jana S. Petermann | Paris Lodron University of Salzburg | PLUS |
Lead Authors
| Andreas Baumgarten | Austrian Agency for Health and Food Safety | AGES |
| Benedikt Becsi | BOKU University |
| Stefan Dullinger | University of Vienna |
| Stephan Glatzel | University of Vienna |
| Andreas Gobiet | GeoSphere Austria |
| Martin Kainz | University for Continuing Education Krems |
| Gregor Laaha | BOKU University |
| Manfred Lexer | BOKU University |
| Douglas Maraun | University of Graz |
| Lindsey Nicholson | University of Innsbruck | UIBK |
| Marc Olefs | GeoSphere Austria |
| Christine Stumpp | BOKU University |
| Christian Zangerl | BOKU University |
Contributing Authors
| Birgit Bednar-Friedl | University of Graz |
| Sven Fuchs | BOKU University |
| Manfred Ganekind | GeoSphere Austria |
| Katharina Gangl | Institute for Advanced Studies | IHS |
| Veronika Gaube | BOKU University |
| Sarah Haider-Nash | University for Continuing Education Krems |
| Susanne Hanger-Kopp | International Institute for Applied Systems Analysis | IIASA |
| Klaus Haslinger | GeoSphere Austria |
| Johann Hiebl | GeoSphere Austria |
| Martin Jury | City of Graz |
| Roland Kaitna | BOKU University |
| Margreth Keiler | University of Innsbruck | UIBK & Austrian Academy of Sciences | ÖAW |
| Stefan Kienberger | GeoSphere Austria |
| Konrad Mayer | GeoSphere Austria |
| Albert Osso Castillon | University of Graz |
| Stefanie Peer | Vienna University of Economics and Business | WU |
| Georg Pistotnik | GeoSphere Austria |
| Thomas Schinko | International Institute for Applied Systems Analysis | IIASA |
| Jan Steinhauser | International Institute for Applied Systems Analysis | IIASA |
| Anna-Maria Tilg | GeoSphere Austria |
Chapter Scientist
| Benedikt Becsi | BOKU University |
Review Editors
| Georg Kaser | University of Innsbruck | UIBK |
| Massimiliano Zappa | Swiss Federal Institute for Forest, Snow and Landscape Research | WSL |
Liaison from AAR2 Technical Support Unit
| Monika Mayer | BOKU University |
TABLE OF CONTENTS
Glossary: aar2.ccca.ac.at/glossary
List of abbreviations: aar2.ccca.ac.at/abbreviations
Appendix: aar2.ccca.ac.at/appendix/1
Full report: aar2.ccca.ac.at/report
EXECUTIVE SUMMARY
Changes in Austria’s thermal environment are detectable both for the mean and for the extremes, with a particularly pronounced acceleration of temperature increase since the 1980s (high confidence). The temperature increase is markedly stronger in Austria than in the global mean, mainly due to the regional thermodynamic and dynamical forcings in large parts of Europe (high confidence). {1.2.1}
- In Austria, the annual mean surface air temperature until 2024 has increased by 3.1°C since pre-industrial times. Since the 1980s, this warming has been particularly strong (+0.5°C per decade) in Austria and other parts of Europe. {1.2.1}
- Temperature extremes during the day and at night, such as hot days or tropical nights, and the associated heat stress, have increased significantly in the summer half-year (April-September). This increase is particularly pronounced in urban areas. In Austrian federal province capitals, heat waves are now 50 % more frequent and 1–4 days longer than in previous decades (1991–2020 vs. 1961–1990). {1.2.1}
- The number of hot days in very hot years (with a statistical return period of 10 years) has increased on average by the factor of 3 in these periods. {1.2.1}
All climate projections show a further increase of the global mean temperature at least until mid-century. The development thereafter strongly depends on the amount of anthropogenic greenhouse gas emissions. Assuming a continuation of current policies, anthropogenic greenhouse gas emissions are projected to lead to a median global warming of 2.7°C [2.2 to 3.4°C] by 2100. The temperature increase in Austria continues to be higher than the global mean. Heat extremes will become more severe. The frequency and duration of heat waves will increase and the temperature within individual heat waves will strongly increase (high confidence). {1.2.2}
- Mean temperatures over Austria are clearly projected to increase for all seasons with increasing levels of global warming (high confidence). Compared to the past (climate period 1961–1990), annual mean temperatures are expected to increase by 2.0°C, 2.6°C, 3.6°C and 4.9°C at global warming level (GWL) 1.5°C, GWL 2.0°C, GWL 3.0°C and GWL 4.0°C, respectively. {1.2.2}
- The number of hot days in a very hot year occurring once in 10 years in the past (climate period 1961–1990) will likely multiply 3.5 times at GWL 1.5°C, 4.3 times at GWL 2.0°C, 5.7 times at GWL 3.0°C, and even 8.1 times at GWL 4.0°C on average for Austria. In addition, the average temperature of heat waves will likely increase by 6.6°C at GWL 4.0°C compared to the climate period 1961–1990 (robust evidence, low agreement). {1.2.2}
- Projections of future temperature for Austria represent conservative estimates and need to be interpreted with caution given the cold bias (largely driven by deficiencies in aerosol forcing and atmospheric dynamical components) of the regional climate models backing the ÖKS15 ensemble. Current warming is already exceeding temperature projections at low GWLs. It is expected that Austrian mean air temperatures in the future exceed global mean temperatures by at least a factor of 1.3 (high confidence). {1.2.1, 1.2.2}
The observed and future temperature changes in Austria are directly linked to changes in several other climatological variables and have far-reaching consequences (robust evidence, medium agreement). {1.2.1, 1.2.2}
- Average evaporation in Austria has increased by about 110 mm/yr in total over 35 years (1978–2013) and will increase with further warming (high confidence). {1.4.1} Increased evaporation contributes significantly to low flows in rivers and streams, to the severity of droughts and to changes in the water level of Lake Neusiedl (robust evidence, medium agreement). {1.4}
- Since the 1960s, snow cover duration (SCD) has decreased by 5–10 days per decade in the entire Alpine region, including Austria. Until the year 2050, SCD in Austria will most likely continue to decrease by at least 5 days per decade on average (high confidence). {1.3.1}
- All glaciers in Austria are losing mass and have been shrinking at an accelerating rate in recent years. 40 % of glacier area in Austria were lost between 1969 and 2015. Actual deglaciation before the end of the century is virtually certain (high confidence). {1.3.2}
- The intensity of multi-day, daily and small-scale short-duration (hourly) heavy precipitation events has increased in the warm season (May-September), closely following the observed rise in temperature and associated increase in the water vapor content of the air (robust evidence, medium agreement). {1.2.1}
- Daily maximum precipitation with a 10-year return period will likely increase by 14.3 % at GWL 1.5°C, 17.2 % at GWL 2.0°C, 23.4 % at GWL 3.0°C and 30.3 % at GWL 4.0°C compared to the past (climate period 1961–1990) (medium confidence). {1.2.2}
The impact of anthropogenic climate change on precipitation in Austria is much more complex than on temperature. It shows regional and seasonal variations and differs for climatological sums (e.g., seasonal or annual sums) and for individual precipitation events (robust evidence, medium agreement). {1.2, 1.4}
- Seasonal mean precipitation in Austria is projected to increase in winter (high confidence) and decrease in summer (robust evidence, medium agreement). These changes are clearly evident under high emissions scenarios or GWL 3.0°C and higher. {1.2.2}
- There is a regional difference in long-term changes in seasonal precipitation over the last 200 years, especially in winter, of the order of 10–15 %, with an increase in western Austria and a decrease in south-eastern Austria (high confidence), probably due to decadal variability (medium confidence). {1.2.1}
Observed floods (fluvial and pluvial) show an increase in part of the catchments (medium confidence). For fluvial floods, the trend is more pronounced in smaller catchments (24 % show increasing trends) than in larger catchments. There is a clear seasonal shift from winter and spring floods to summer floods, so that summer is now also the dominant flood season in the eastern half of Austria. Climate projections indicate a potential increase and notable seasonal shift in flood occurrences in Austria, particularly an increased frequency of summer floods due to more intense and localized extreme precipitation events, especially in the Alps and smaller river basins (robust evidence, medium agreement). {1.4.1}
Low-flow trends in Austria (both drying and wetting) have become more pronounced in recent years compared to the previous assessment (high confidence). Low flow discharges have increased in alpine catchments (+23 % over 43 years (1977–2019)) and decreased in lowland catchments (-17 % over the same period). They are expected to continue to decrease in the lowlands of eastern and southern Austria. In alpine catchments, low flows will increase significantly due to decreasing frost. {1.4.1}
The surface water temperature of all monitored lakes has increased during the last 20 to 40 years (high confidence). The surface temperature of selected lakes in Austria has increased concurrently with increasing air temperature by an average of between 2.0°C (last 40 years) and 1.5°C (last 15 years). Since lake surface water temperature is closely correlated with changes in air temperature, lake surface water temperature is expected to increase in the future. Higher lake water temperatures lead to higher lake metabolism, which leads to higher respiration, and thus to higher emissions of greenhouse gases such as CO2, and possibly N2O and CH4. {1.4.2}
The water loss in Lake Neusiedl in the years 2021 and 2022 is primarily the result of evaporation due to high temperatures (surface water temperatures exceeded 30°C at times in summer) and a decrease in precipitation (medium confidence). Ongoing climate change will have a significant impact on the future of Lake Neusiedl and its surrounding ecosystems, with lower average water levels, especially in summer, and as yet unknown effects on the species community. {1.4.2}
Currently and in future projections, there is a west-east gradient with generally higher groundwater recharge in the western part of Austria than in the eastern or south-eastern part (high confidence). Seasonal changes in groundwater recharge are expected in the future, but they depend strongly on climate scenarios (limited evidence, medium agreement). Available groundwater resources may decrease by up to 23 % by 2050, and regionally by as much as 30 % (medium confidence). {1.4.3}
Changes in water and temperature regimes will significantly increase soil erosion (high confidence). This occurs due to increased frequency of convective events and expected extreme precipitation, if no countermeasures are taken. {1.5}
High temperatures combined with sufficient water supply will lead to increased loss of soil organic carbon (high confidence). Mineralization of soil organic carbon will be enhanced by higher temperatures at sites with sufficient precipitation (e.g., at higher sea level). {1.5}
Land use and climate change are the most important drivers of wetland degradation (high confidence). Many wetlands will lose important ecosystem functions such as carbon storage, resulting in positive feedbacks with climate change (high confidence). Other commonly affected ecosystem functions include water retention (medium evidence, high agreement) and the support of biodiversity (medium evidence, high agreement). {1.6.1}
Limited water supply will be the most important direct impact factor in Austrian forests (high confidence). Disturbance regimes (storms, snow, insects, fungi) will intensify and strongly affect the provision of ecosystem services (high confidence). Forest management decisions will strongly determine the pathways and speed of adaptation in species composition (medium confidence). {1.6.2}
Climate change drives species ranges upslope in elevation and promotes the replacement of cold-adapted species by warm-adapted species in many taxonomic groups (high confidence) and a decline in some habitats such as alpine grasslands (limited evidence, high agreement). Under strong further warming, major population declines, and increased vulnerability are expected especially for cold-adapted species of higher altitudes (high confidence), including many endemic taxa, whose eventual extinction would reduce Austria’s unique contribution to the global species pool (high confidence). {1.6.4}
Climate change mitigation via land-based carbon dioxide removal and energy decarbonization could have significant negative impacts on biodiversity (medium evidence, high agreement). However, carefully designed, e.g. via appropriate spatial planning or tree species selection for afforestation these measures can also generate double benefit for the intertwined climate and biodiversity crises. {1.6.4}
Climate change will lead to responses in Earth’s surface processes, and thus to a change in the causes and triggers of landslides (medium confidence). Permafrost degradation, glacier retreat, and extreme precipitation conditions are the most obvious factors responsible for increasing landslide activity of various types, although data for the Austrian Alps need to be substantially improved. The frequency of shallow earth/debris slides and debris flows will increase in Austria. In the high mountains, affected by glacier retreat and permafrost degradation, a further increase in rock fall/avalanche and rock slide activity is expected. {1.7}
Depending on the topographic situation, climate change will have a significant impact on different types of natural hazard processes in Austria (medium confidence). Numerous cascading or compound processes have been identified for Austria in the past, some of which have resulted in major damage and high financial losses. These processes should be given special attention in the future. {1.8}
1.1. Chapter introduction
1.1.1 Setting the scene
The concept of Chapter 1 is to provide general information on the current situation as well as on historical and future developments of the climate system, its components and the direct impacts on the natural environment in Austria. Basic processes and drivers and their response to anthropogenic climate change are described. The chapter provides important reference data on past and future changes in climate indices, general trends and extremes for the subsequent chapters. The chapter is divided into subchapters according to the spheres involved in the processes.
- The introduction (Section 1.1) describes the physiographical and climatological characteristics of Austria.
- Section 1.2 focuses on the atmosphere and discusses processes relevant to weather and climate in Austria and their response to anthropogenic climate change in the past and the future.
- Section 1.3 covers the cryosphere, including regional/temporal occurrence, drivers and magnitude of past and future changes, and interactions and impacts on other natural systems.
- The subchapter ‘Hydrosphere’ (Section 1.4) summarizes the understanding and assessment of the impacts of climate change on runoff generation processes and the magnitude, seasonality and frequency of water fluxes in streams, groundwater and lakes, including extremes and water quality.
- The subchapter ‘Pedosphere’ (Section 1.5) discusses the types and characteristics of soils in Austria, identifies the most important representatives and assesses the effects and feedbacks of climate change and other global change drivers on soils via erosion and the dynamics of organic matter and water.
- The subchapter ‘Biosphere’ (Section 1.6) focuses on selected important habitats and land use categories (according to the IPCC) that will be strongly affected by climate change and also have important feedback effects on climate change. The effects of a changing climate on biodiversity are summarized across habitats and taxonomic groups.
- The subchapter ‘Lithosphere’ (Section 1.7) focuses on the description of the Earth’s geological and geomorphological processes in Austria, with emphasis on exogenous processes, in particular landslides of various types relevant to the Alpine region of Austria. These processes are strongly controlled by climate.
- The last subchapter (Section 1.8) focuses on the cross-cutting issue of natural hazards, describing those occurring in Austria and their response to anthropogenic climate change. An overview of natural hazard processes and relevant hazard cascades in Austria is summarized in a table (Table 1.A.4).
1.1.2 Physiographic setting of Austria
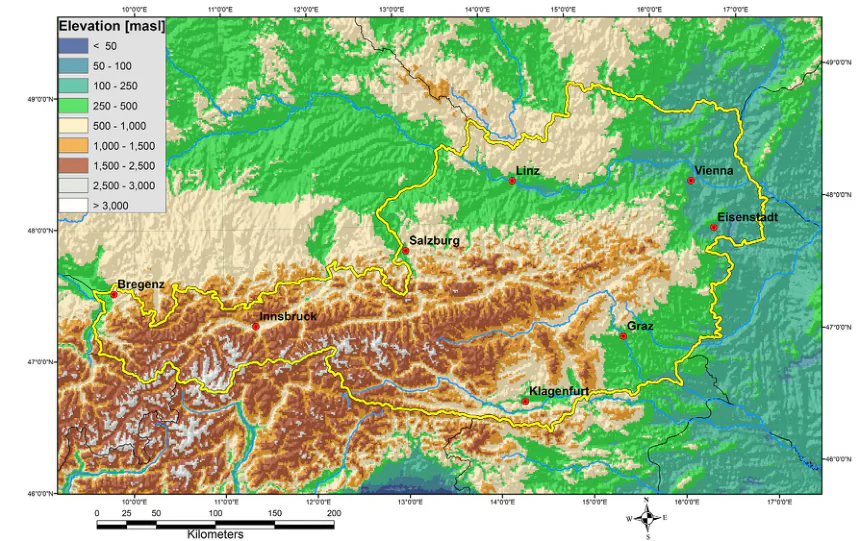
Austria is a small country in Central Europe (see Figure 1.1). It has an area of 84,000 km2 and a population of about 9 million (Statistik Austria, 2023) with an urbanization rate of ~60 % (World Bank, 2023). The population increased by 11.3 % between 2000 and 2020, with the proportion of very old people (80+) increasing from 3.5 % to 5.5 % (Federal Ministry of Social Affairs, Health, Care and Consumer Protection, 2021). Almost two-thirds of the country is mountainous. Austria’s high mountain regions are dominated by the Eastern Alps, but the granite and gneiss plateau in the north of the country also reaches heights of 1,379 m a.s.l.
The Alps in Austria extend from the western edge of the country to the far east. At the Großglockner, they reach 3,798 m a.s.l., which is the highest point in the country. Throughout western Austria, peaks exceed 3,000 m a.s.l. While Austria’s western regions are entirely in the Alps, east of Salzburg, the granite and gneiss plateau extends to Austria’s borders with Germany and the Czech Republic, north of the foothills of the Alps. The east of the country is occupied by lowlands: The Carpathian foothills to the north and the Pannonian Plain farther south. In the southeast, the southeastern foothills of the Alps border Hungary and Slovenia. The lowest point of Austria is located east of Lake Neusiedl, near the border with Hungary, at 114 m a.s.l. Austria’s topographic situation has a strong influence on the country’s settlement structure, land use, vegetation and climate, including the occurrence and relevance of natural hazards.
Austria’s topographic and climatological conditions result in very heterogeneous and diverse landscapes. On the highest mountain peaks, a relevant part of the precipitation currently falls as snow, even in summer, and at altitudes above 3,000 m a.s.l., there are glaciers and permafrost. Thus, several climate zones, from the snow-dominated nival to the wine-growing lowlands, extend over a few tens of kilometers (Rubel et al., 2017). Elevation-dependent air temperature variability is influenced by windward and leeward modulated precipitation, leading to small-scale variability of ecosystems. Climate gradients themselves are superimposed by land use pressure and history to shape ecosystem variability. Due to the short distances between different climatic and ecosystem zones, climate change-induced migration of biota can occur immediately, unless there are local (natural or anthropogenic) barriers to migration (Holzinger et al., 2008).
1.1.3 Climatological conditions
Due to Austria’s location in the mid-latitudes (~48 °N), radiation and temperature show a pronounced seasonal cycle. In the warmest areas of Austria, the lowlands in the east and south, the annual mean temperature reaches 12°C and drops to -6°C on the highest mountain peaks. Extreme daily maximum temperatures reach 40°C in summer and -30°C in winter. These extremely low temperatures are not limited to the mountain peaks. Even in the northeastern lowlands, temperatures below -20°C occur during cold spells (Lhotka and Kyselý, 2015), when continental ‘Siberian’ air masses are advected to Central Europe.
The Austrian precipitation distribution is dominated by the advection of maritime air masses and the associated windward/downwind effects at mountain ridges. The main source of moisture is the Atlantic, but maritime air masses can also originate from the North, Baltic, Mediterranean or Black Sea, leading to very complex precipitation patterns. The driest area is in the northeast, with an average annual rainfall of nearly 500 mm. In the northern and southern ‘Stau-regions’ values up to 2500 mm occur (Stangl et al., 2021). Due to windward/downwind effects even nearby mountain valleys, such as the upper Inn valley, receive only 700 mm.
Convective precipitation is an important source of moisture in Austria during the summer half year. Especially areas in the transition zone between the lowlands and the foothills, such as the ‘Steirische Randgebirge’ or the Upper Austrian foothills, have a high probability of thunderstorms (Schulz et al., 2005) and associated high local short-term precipitation intensities.
Large-scale precipitation extremes are mainly associated with cut-off lows centered at the European Alps (Awan and Formayer, 2017), where warm and moist Mediterranean air is transported to the Alps over several days and precipitation totals of more than 200 mm can be reached.
The hydrological conditions show a similarly high diversity (Merz et al., 2008). Nival-dominated discharge patterns are common for alpine rivers, with low flows in winter and a pronounced discharge maximum during the snowmelt period. In foothill catchments in the east and south, snowmelt plays a minor role and low flows occur not in winter but in summer and fall. Steep terrain and localized heavy precipitation from thunderstorms often lead to pluvial floods and mass movements. Fluvial floods, especially those of the Danube, are caused by completely different processes, such as cut-off lows, but snowmelt and the elevation of the snow line during the precipitation event also contribute to these events.
The first Austrian Assessment Report (APCC, 2014) provides a detailed description of the Austrian climate. In the decade since this report was written, anthropogenic climate change has continued in Austria. Several hot and dry summers, such as during 2015 or 2018, highlighted the vulnerability of Austrian agriculture and especially forestry, as well as the importance of heat mitigation measures in urban areas. Local or temporary water shortages became a topic in the media, and other extreme events such as local flash floods, forest fires, or spring frost damage became more visible to the general public.
1.2. Atmosphere
This subchapter discusses the drivers and processes relevant for weather and climate in Austria and their response to anthropogenic climate change in the past and in the future. It describes the current situation and past and future changes based on climatological indicators. Climate change projections are discussed in the context of climate change signal, depending on emission scenarios and general skills and limitations of models at global and regional scale.
Regional climate variability and change result from both natural and anthropogenic forcings external to the climate system, internal climate variability, and feedbacks between them (Doblas-Reyes et al., 2021). Anthropogenic forcings include changes in greenhouse gas concentrations, aerosols, and land use. The strength of the regional response to external forcings is first determined by climate sensitivity, which is the overall temperature response to radiative forcings such as greenhouse gases. Our understanding of this key property of the climate system has improved considerably in recent years. The best estimate of equilibrium climate sensitivity is a 3°C increase in global mean surface temperature (with likely and very likely ranges of 2.5°C to 4°C and 2°C to 5°C, respectively) for a doubling of CO2 concentrations (IPCC, 2021b). A key determinant of regional climate change is changes in atmospheric circulation, i.e., how large-scale to regional-scale winds and weather systems respond to overall temperature changes. Regional feedbacks between the land-surface and the atmosphere further modulate the strength of regional climate changes.
1.2.1. Past changes
The current IPCC report (AR6) assesses past global changes back to the deep past (65 million years before present) in Chapters 2 and 11 (observations, weather and climate extremes) (Gulev et al., 2021; Seneviratne et al., 2021). The historical investigations in this subchapter are limited to the period after 1850. This is consistent with the IPCC definition of the ‘pre-industrial’ period. The focus is on describing climatological changes within this period based on impact-relevant climatological indicators and their dependence on large-scale processes and drivers.
Observed changes in global climate drivers
Increases in greenhouse gas concentrations and trends in aerosol concentrations and properties due to anthropogenic activities lead to a net positive effective radiative forcing and an imbalance in the Earth’s energy balance, resulting in a warming planet since the late 19th century and at an increasing rate since the 1970s. The change in effective radiative forcing due to natural factors since 1750 is negligible compared to anthropogenic forcings (Gulev et al., 2021).
Observed changes in large scale circulation, weather patterns and modes of variability
Since the late 19th century, major modes of climate variability relevant to the European climate, such as the North Atlantic Oscillation (NAO) or the Atlantic Multidecadal Variability (AMV) show no persistent trends but fluctuate in frequency and magnitude on interdecadal time scales. Due to the expansion of the tropical circulation, a poleward shift of extratropical jets and cyclone tracks has been observed since the 1980s, with marked seasonality in the trends. Since the 1970s, there has been a global weakening of surface winds, especially over land in the northern hemisphere (Gulev et al., 2021).
Observed changes in selected essential climatic variables in Austria and Europe
Air temperature
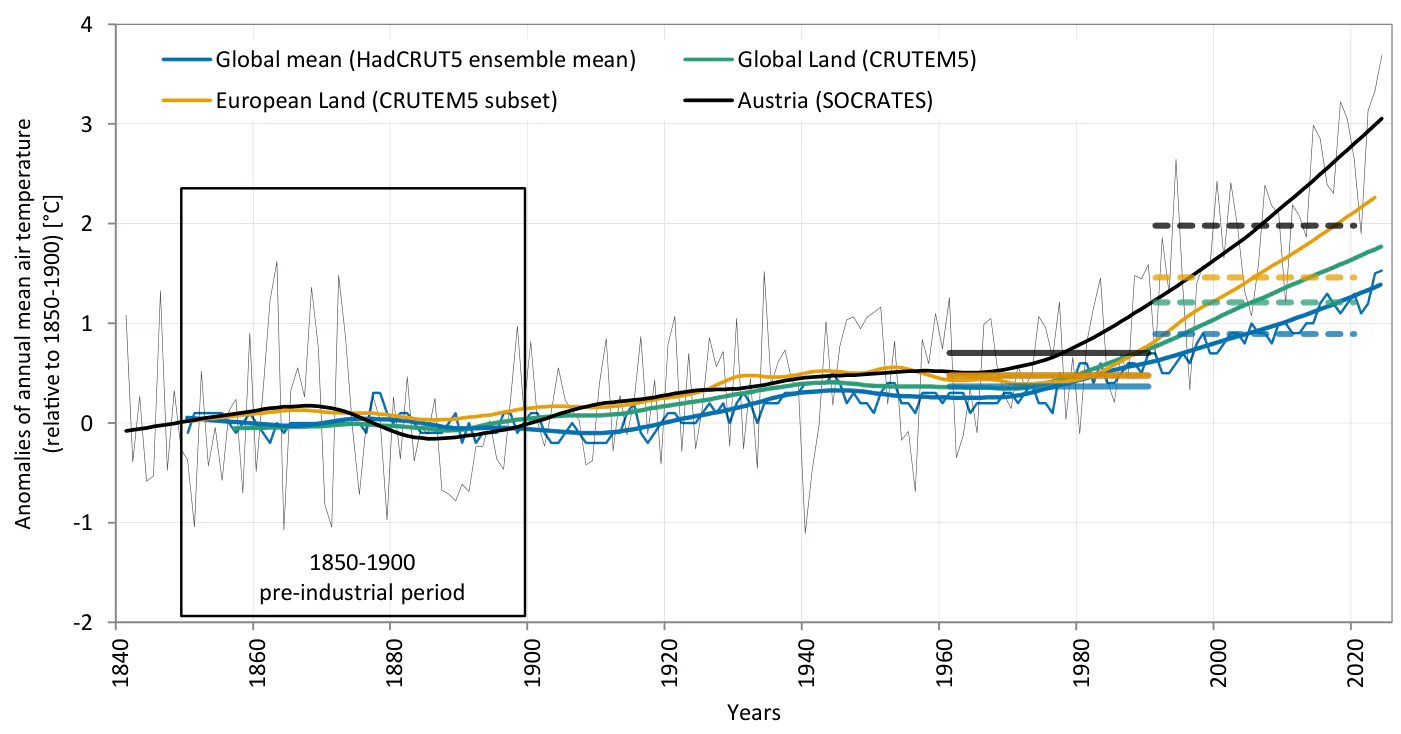
According to a recent analysis (Chimani et al., 2024), the mean annual air temperature in Austria has increased by 3.1°C since pre-industrial times, from 5.1°C (1850–1900) to 8.1°C in 2024 (Figure 1.2, Table 1.1). Primary drivers (contribution of ~70 %) of this excessive warming compared to the global average are regional thermodynamic and dynamical forcings in large parts of Europe, as described below. Secondary drivers (contribution of ~30 %) are related to heat capacity (faster warming of air over land) and latent heat fluxes (evaporative cooling over oceans) as well as the different scales (IPCC, 2019a; Chimani et al., 2021).
As a primary driving component of the excessive warming, the regional thermodynamic forcing is dominated by increasing incoming near-surface solar radiation in large parts of Europe since the 1980s. This is due to a 50 % decrease of aerosol loads (Glantz et al., 2022; Philipona et al., 2023; Schumacher et al., 2024) and a decrease in cloudiness associated with the indirect aerosol effect and large-scale atmospheric circulation changes (Sfîcă et al., 2021). Schumacher et al. (2024) estimate the relative contributions of these two effects to be two thirds (aerosols) and one third (dynamic circulation effect), respectively. From a temporal perspective, the aerosol effect is mainly restricted to the period 1983–2002, while the cloudiness effect unfolds in the period 2001–2020 (Schilliger et al., 2024). A reduced cooling effect due to less aerosols unmasks the thermal greenhouse warming effect (increasing thermal longwave downward radiation) due to steadily increasing anthropogenic greenhouse gas concentrations in the atmosphere (Philipona et al., 2023) and readjusts the shortwave clear-sky transmissivity of the atmosphere to pre-1950s values (Wild et al., 2021) and beyond (the latter due to circulation changes). In addition to the strong reduction of aerosol loads, positive regional feedbacks, especially the soil moisture (Haslinger et al., 2021; Glantz et al., 2022) and snow/ice albedo (Kiem et al., 2024) feedbacks, amplify the regional thermodynamic effect, leading to the fact that Europe has warmed faster than any other World Meteorological Organization region since the 1980s (Schumacher et al., 2024); in Austria with an enormous rate of almost 0.5°C per decade. Moreover, a large part of the warming since pre-industrial times has occurred in the last four decades since 1980, and the five-year period 2019–2023 was already 2.7°C warmer than in pre-industrial times (Table 1.1). The observed warming of global land masses (CRUTEM data) exceeds global average warming by a factor of at least around 1.3. Since this discrepancy is mainly attributed to different heat capacities, it is expected to hold as lower limit for future temperature development.
Within Austria, the long-term variations of the annual air temperature show a large spatial concordance. There are no significant regional or altitudinal differences. In mountainous regions, the atmosphere warmed by the same amount as in the lowlands (Auer et al., 2007; Kuhn and Olefs, 2020). Air temperature variations in the free atmosphere at about 3,000 m a.s.l. derived from radiosonde data are very similar to the time series recorded at summit stations (Haimberger et al., 2012). This lack of observed elevation dependence based on Austrian station data contrasts with future temperature projections (see Section 1.2.2 and Chapter 7) and analyses of gridded datasets in the greater Alpine region (Pepin et al., 2022), which show stronger warming at mid to high elevations. As many mechanisms for elevation dependence operate simultaneously, some independently, most of them interconnected by feedbacks, this discrepancy may be due to model simplification (e.g., too coarse spatial resolution, parameterizations) or to the fact that relevant processes have not yet been triggered (Kuhn and Olefs, 2020; Pepin et al., 2022).
Text of the graphic
Anomalies of annual mean air temperature (relative to 1850-1900) [°C]
-2
-1
0
1
2
3
4
1840
1860
1880
1900
1920
1940
1960
1980
2000
2020
Years
Global mean (HadCRUT5 ensemble mean)
Global Land (CRUTEM5)
European Land (CRUTEM5 subset)
Austria (SOCRATES)
1850-1900
pre-industrial period
* defined by the bounding box 25 °W – 40 °E, 34 °N – 72 °N;
** derived from the 41-year smoothed value (LOESS filter).
| Climate normals (30-year average periods) | Global mean (HadCRUT5 ensemble mean) [°C] | Global land areas (CRUTEM) [°C] | European land areas (CRUTEM subset*) [°C] | Austria (SOCRATES) [°C] |
|---|---|---|---|---|
| 2024** | 1.4 | 1.8 | n/a | 3.1 |
| 2023** | 1.32 | 1.71 | 2.26 | 3.0 |
| 1991–2020 | 0.89 | 1.21 | 1.47 | 1.98 |
| 1961–1990 | 0.37 | 0.48 | 0.48 | 0.7 |
From a seasonal perspective and based on homogenized long-term observations, the warming in the lowlands during the period 1991–2020 vs. 1850–1900 is strongest in spring and winter (+2.1°C and +2.3°C, respectively), followed by summer (+2.0°C), and weakest in autumn (+1.4°C). The only significant warming difference between lowland and summit regions is observed in winter (+2.3°C vs. +1.7°C) (Kuhn and Olefs, 2020). This may be due to the reduction of aerosols at their highest concentration near ground sources, which contributes to stronger warming at low elevations (Philipona et al., 2009; Philipona, 2013).
Smaller-scale phenomena such as temperature inversions are associated with the accumulation of pools of cold air near the surface. An analysis of daily gridded observational data in the period 1961–2017 shows that inversions have become less frequent and less intense, especially in the months of October, December, and January in southern Austria and near the main Alpine ridge (Hiebl and Schöner, 2018).
The marked temperature increase since 1980 has led to pronounced changes in temperature dependent extreme values. For example, the number of summer days and hot days (daily maximum temperature ≥25°C and ≥30°C, respectively) in the Austrian lowlands increased significantly by 40 % and 66 %, respectively (see Table 1.2). The number of hot days in very hot years (occurring with a statistical return period of 10 years) has tripled between the periods 1961–1990 and 1991–2020 on average over Austria (GeoSphere Austria, 2020). In addition, heatwaves have increased in intensity, duration and frequency in the Austrian federal province capitals: In the period 1991–2020 compared to 1961–1990, heatwaves became 50 % more frequent and 1 to 4 days longer (GeoSphere Austria, 2023a). In urban areas, heat stress is intensified during the day and at night (urban heat island effect) (Oke et al., 2017). In Austrian province capitals, the number of hot days increased by 6 to 14 days (factor of 1.5 to 4.3) in the 30-year period 1991–2020 compared to 1961–1990. In the same period, tropical nights (daily minimum temperature ≥20°C) increased by up to 5 days.
As of 2024, a record number of 29 to 52 hot days in a single year is recorded in these cities (GeoSphere Austria, 2023b). In addition to these increasing mean and extreme temperature values, the available literature shows no significant long-term change in temperature variability on synoptic time scales in Austria since the end of the 19th century (Hiebl and Hofstätter, 2012).
In general, annual and multi-decadal variations are superimposed on the long-term anthropogenic warming trend. Due to atmosphere-ocean feedbacks and the relative importance of circulation changes during the cold season, winter temperatures in Austria show the largest variability of all seasons. After a short cooling phase (between 1995–2005 in the lowlands and 1989–2012 in the summit regions) induced by natural variability and associated atmospheric circulation changes (Saffioti et al., 2016), winter temperatures started to increase again (Olefs et al., 2021).
Finally, the observed temperature increase in Austria is confirmed by independently measured air pressure time series at different elevations (Kuhn and Olefs, 2020).
Short name | altitudinal range (m a.s.l.) | ≤500 m | 501–1,000 m | 1,001–1,500 m | 1,501–2,000 m | ≥2,001 m | ||||||||||||||||
|---|---|---|---|---|---|---|---|---|---|---|---|---|---|---|---|---|---|---|---|---|---|---|
Indicator name | Unit | 1961– 1990 | 1991– 2020 | diff. | diff. (%) | 1961– 1990 | 1991– 2020 | diff. | diff. (%) | 1961– 1990 | 1991– 2020 | diff. | diff. (%) | 1961– 1990 | 1991– 2020 | diff. | diff. (%) | 1961– 1990 | 1991– 2020 | diff. | diff. (%) | |
su25 | summer days | d | 45 | 64 | +19 | +42 | 25 | 39 | +14 | +56 | 7 | 15 | +8 | +114 | 1 | 2 | +1 | +100 | 0 | 0 | 0 | |
su30 | hot days | d | 6 | 16 | +10 | +167 | 2 | 6 | +4 | +200 | 0 | 1 | +1 | 0 | 0 | 0 | 0 | 0 | 0 | |||
tr20 | tropical nights | d | 0 | 1 | +1 | 0 | 0 | 0 | 0 | 0 | 0 | 0 | 0 | 0 | 0 | 0 | 0 | |||||
kys | heat episodes (kysely days) | d | 4 | 14 | +10 | +250 | 0 | 4 | +4 | 0 | 0 | 0 | 0 | 0 | 0 | 0 | 0 | 0 | ||||
cool | cooling degree days (20°C tresh) | °C | 43 | 107 | +64 | +149 | 9 | 34 | +25 | +278 | 1 | 5 | +4 | +400 | 0 | 0 | 0 | 0 | 0 | 0 | ||
gsl | vegetation period (5°C) | d | 224 | 235 | +11 | +5 | 196 | 208 | +12 | +6 | 166 | 180 | +14 | +8 | 123 | 142 | +19 | +15 | 52 | 75 | +23 | +44 |
fd0 | freezing days | d | 104 | 90 | -14 | -13 | 134 | 117 | -17 | -13 | 163 | 146 | -17 | -10 | 191 | 173 | -18 | -9 | 245 | 224 | -21 | -9 |
id0 | ice days | d | 29 | 22 | -7 | -24 | 41 | 32 | -9 | -22 | 56 | 44 | -12 | -21 | 82 | 67 | -15 | -18 | 149 | 128 | -21 | -14 |
id7 | extreme ice days | d | 17 | 11 | -6 | -35 | 27 | 18 | -9 | -33 | 40 | 30 | -10 | -25 | 61 | 48 | -13 | -21 | 115 | 95 | -20 | -17 |
hdd | heating degree days | °C | 3662 | 3306 | -356 | -10 | 4384 | 3976 | -408 | -9 | 5232 | 4796 | -436 | -8 | 6196 | 5723 | -473 | -8 | 7647 | 7189 | -458 | -6 |
rr1 | precipitation days (1 mm) | d | 112 | 110 | -2 | -2 | 135 | 134 | -1 | -1 | 143 | 143 | 0 | +0 | 149 | 149 | 0 | +0 | 150 | 153 | +3 | +2 |
rr20 | heavy precipitation days (20 mm) | d | 6 | 7 | +1 | +17 | 10 | 12 | +2 | +20 | 15 | 16 | +1 | +7 | 17 | 18 | +1 | +6 | 17 | 18 | +1 | +6 |
sdii | precipitation intensity | mm | 6.4 | 6.7 | +0 | +5 | 7.6 | 7.9 | +0 | +4 | 8.7 | 9 | +0 | +3 | 9.1 | 9.4 | +0 | +3 | 8.9 | 9.3 | +0 | +4 |
rx5day | max. 5-day precipitation | mm | 70 | 77 | +7 | +10 | 91 | 97 | +6 | +7 | 108 | 111 | +3 | +3 | 116 | 119 | +3 | +3 | 115 | 121 | +6 | +5 |
cdd | longest dry period | d | 24 | 24 | 0 | +0 | 21 | 21 | 0 | +0 | 20 | 20 | 0 | +0 | 20 | 20 | 0 | +0 | 19 | 19 | 0 | 0 |
hd1525 | dry hiking days | d | 100 | 86 | -14 | -14 | 83 | 82 | -1 | -1 | 67 | 71 | 4 | +6 | 40 | 47 | 7 | +18 | 10 | 16 | 6 | 60 |
cloudy | number of cloudy days | d | 149 | 136 | -13 | -9 | 149 | 137 | -12 | -8 | 141 | 130 | -11 | -8 | 143 | 134 | -9 | -6 | 145 | 137 | -8 | -6 |
clear | number of clear days | d | 69 | 86 | +17 | +25 | 76 | 88 | +12 | +16 | 88 | 93 | +5 | +6 | 93 | 96 | +3 | +3 | 98 | 98 | 0 | 0 |
SPEI | climatic water balance (normalized) | - | 0.10 | -0.10 | -0.20 | -0.01 | 0.00 | 0.01 | -0.01 | 0.00 | 0.01 | 0.02 | 0.00 | -0.02 | -0.02 | 0.08 | 0.10 | |||||
CWB | climatic water balance (abs) | mm | -60 | -90 | -30 | +50 | +337 | +339 | +2 | +1 | +556 | +558 | +2 | +0 | +658 | +650 | -8 | -1 | +740 | +752 | +12 | +2 |
Drought conditions
Meteorological droughts are prolonged periods of below-normal water availability due to a lack of precipitation and/or increased atmospheric evaporative demand (i.e., potential evapotranspiration). An important driver of droughts are anomalies in atmospheric circulation that result in frequent and often persistent anticyclonic weather patterns (Haslinger et al., 2019; Lhotka et al., 2020). In northern Europe, the North Atlantic Oscillation (NAO) is of great importance in this respect, but less so in the Alpine region. In Austria, the East Atlantic-Western Russia (EAWR) circulation pattern explains the occurrence of early spring drought (Ionita et al., 2020; Haslinger and Mayer, 2022). Spring droughts often lead to soil moisture-temperature feedbacks, which may contribute to elevated temperatures during summer droughts (Seneviratne et al., 2010; Haslinger and Blöschl, 2017). When meridional circulation features dominate during the summer season, large-scale moisture transport is reduced and local moisture recycling is enhanced. In already dry soils, insufficient moisture is available for local evapotranspiration processes and precipitation deficits occur (soil moisture-precipitation feedback) (Haslinger et al., 2021). The seasonality of drought events has shifted from predominantly winter and spring events in the 19th century to late summer/autumn events. This seasonal shift is accompanied by a spatial change from the northwest to the southeast of Austria (Haslinger and Blöschl, 2017).
There are no significant trends in the frequency, duration and intensity of precipitation deficits in Austria over the last two centuries for which instrumental records are available (Haslinger and Blöschl, 2017; Hanel et al., 2018). However, periods with distinct negative precipitation anomalies are observed, most notably the ‘drought decades’ of the 1860s and 1940s (Brunetti et al., 2009; Haslinger et al., 2019). The current sequence of drought years (e.g., 2015, 2018, 2021) may be indicative of the manifestation of another drought decade, as drought drivers similar to those of the 1860s and 1940s are at play more recently; namely very dry springs followed by atmospheric circulation characteristics that favor a positive soil moisture-precipitation feedback during the summer. Furthermore, longer drought reconstructions for the last millennium and beyond based on paleoclimate archives such as tree-ring widths (Ionita et al., 2021) and stable isotopes in tree-rings (Büntgen et al., 2021) for Central Europe are contradictory and do not allow a definitive conclusion. However, potential evapotranspiration increased during the period 1977–2014, mainly due to changes in global radiation, but also due to increases in air temperature (Duethmann and Blöschl, 2018), leading to drier soil conditions during the summer half year (Trnka et al., 2009). Higher temperatures also resulted in an earlier onset of the vegetation period and thus a longer evaporation season (Duethmann and Blöschl, 2018), leading to drier conditions during the warm season and, in particular, promoting heat waves (Haslinger and Blöschl, 2017).
The climatic water balance (CWB) is defined as the difference between precipitation and atmospheric evaporative demand and is often used in drought research and monitoring (here mostly as a standardized indicator, e.g., Standardized Precipitation Evapotranspiration Index – SPEI). Comparing two 30-year periods (1961–1990 vs. 1991–2020), the annual CWB in lowland areas (<500 m a.s.l.) decreased by 30 mm, mainly due to an increase in atmospheric evaporative demand. This change is rather small compared to the inter-annual variability of 107 mm (standard deviation of the annual CWB 1961–2020). In contrast, higher elevation areas show no clear change, although in the high alpine regions (>2,000 m a.s.l.) an increase of 12 mm is visible, which is still a rather small increase compared to the mean annual CWB from 1991–2020 of 752 mm (see Table 1.2).
Drought impact inventories in the Alpine region, as well as for Austria specifically, show an increasing trend of reported impacts within the last 45 years, especially after 2000. However, this increase could be influenced by reporting behavior, accessibility as well as awareness of the drought hazard (Stephan et al., 2021).
Precipitation, including convection and associated impacts
Opposing long-term precipitation trends are found in different regions, especially in winter: In western (Vorarlberg, northern Tyrol) and southeastern Austria (parts of Carinthia, western and eastern Styria, southern Burgenland), precipitation totals have increased and decreased by about 10 % and 15 %, respectively, over the last 200 years (Auer, 2014).
An analysis based on the Austrian-wide gridded observation-based precipitation dataset SPARTACUS (Hiebl and Frei, 2018) shows an increase in the annual number of days with heavy (95–98th percentile) to extreme (>98th percentile) precipitation from 1961 to 2014, especially in autumn and summer. This corresponds to a shift in intensities, as the number of days with weak to moderate precipitation decreases. This finding is supported by homogenized daily station data. Table 1.2 shows that the number of heavy precipitation days and the maximum 5-day precipitation sum have increased by 11 % and 5 %, respectively, in the period 1991–2020 compared to 1961–1990. Especially for large-scale heavy precipitation events caused by distinct low-pressure systems (e.g., ‘Vb cyclones’), slightly increasing trends are found for the period 1961–2015 for the northern edge of the Alps (Hofstätter et al., 2018). In September 2024, such an event led to extreme precipitation totals in Central Europe. In Austria, new records for 5-day precipitation totals above 400 mm were set over Upper and Lower Austria and Vienna (Greilinger et al., 2024). In the Tulln area, the previous record of 143 mm was more than doubled. This led to very high water levels in the rivers, even in the Danube, where discharge values with a return period of 30 years were reached. Flood levels in the rivers of the Vienna Woods exceeded the 300-year return period (e.g., Traisen) (Krammer et al., 2024). According to the results of a preliminary attribution study, anthropogenic climate change doubled the probability of this event and made the rainfall 7 % more intense (Kimutai et al., 2024).
Small-scale heavy precipitation events are tied to convection and occur especially in the summer half year. Due to the low density of conventional meteorological measurement networks and the low temporal resolution of measurements before automation in the late 1980s, no reliable estimates of past trends in convective precipitation events and thunderstorms are currently possible in Austria (Pistotnik et al., 2020). This also applies to all phenomena associated with convective events such as hail and tornadoes.
An analysis of extreme hourly precipitation totals (99th percentile) at the Vienna Hohe Warte shows an increase of up to 10 % per °C temperature rise (Formayer and Fritz, 2016). Considering shorter time scales, Schroeer and Kirchengast (2018) found values of up to 14 % per °C based on extreme 10-minute precipitation sums (98th percentile) in southeastern Austria. Both rates clearly exceed the theoretical value given by the Clausius-Clapeyron law, which is confirmed by numerous studies of convective precipitation events (Ivancic and Shaw, 2016; Lochbihler et al., 2019). Increasing latent heat of condensation due to rising air humidity increases instability and thus intensifies convection and precipitation (Lenderink and Van Meijgaard, 2008, 2010).
From a European and global perspective, there is strong evidence that heavy precipitation has increased in recent decades due to anthropogenic forcing in many parts of Europe and the world, although regional differences are evident (Lehmann et al., 2015; Fischer and Knutti, 2016; Fowler et al., 2021; IPCC, 2021a; Robinson et al., 2021; De Vries et al., 2023). Results from a statistical model validated with event data and driven by gridded observational data in the period 1979 to 2016 (ERA-interim) show an increase in the probability of occurrence of thunderstorms, strong winds, and large hail events (Rädler et al., 2018). In addition, Maraun et al. (2024) set up a statistical model for the European domain that relates observed impacts of convective events (local flooding, hail, downbursts etc.) to atmospheric variables indicating convective potential (e.g., Lifted Index) to derive potential days with impactful convective events. The model is applied to ERA5 data from 1950 to 2022. A general increase in the number of days with convective events is found, independent of atmospheric circulation characteristics, due to increasing temperatures and potential for atmospheric instability and convection during the warm season. For example, convective events classified as ‘severe’ (associated with an orange weather warning (level 2 of 3)) increased by 15 % (1991–2020 vs. 1961–1990). Simon et al. (2023) found a corresponding increase in the annual and diurnal cycles of lightning in the high alpine region as well as on the northern and southern alpine rim.
Although no long-term change in annual precipitation totals can be detected for Austria, seasonal sums show clear regional trends. Multi-day, daily and short-duration (hourly) heavy precipitation events indicate clear increasing trends in recent decades with the latter being most strongly related to anthropogenic warming and associated with other potentially harmful small-scale but intense impacts (e.g., local flooding, strong wind gusts, hail and lightning).
Sunshine duration
Since the end of the 19th century, a two-stage increase in observed sunshine duration can be observed in Austria: The first until the middle of the 20th century, the second since the 1980s. A dimming phase between 1950 and 1980 interrupts these increases. The changes are more pronounced at low altitude stations (Auer et al., 2007; Kuhn and Olefs, 2020). The similarity of this trend with observed temperatures and solar surface radiation indicates an important role of solar radiation in explaining the larger temperature increase in Austria and parts of Europe compared to the global land areas (Scherrer and Begert, 2019; Philipona et al., 2023) (see also Figure 1.2 and Sections Air temperature as well as Radiation fluxes and cloudiness). Since 1961, observed sunshine duration in Austria has increased by 13.9 % to 14.8 %, according to a newly available gridded dataset and homogenized long-term time series (Hiebl et al., 2024). By definition, changes in sunshine duration are driven by changes in the direct component of surface solar radiation.
Radiation fluxes and cloudiness
There is strong observational evidence that the amount of solar radiation received at the Earth’s surface undergoes significant multidecadal variations that are internal to the Earth’s atmosphere and not externally forced by the Sun. Coherent periods and regions of dominant decreases (‘dimming’) and increases (‘brightening’) in surface solar radiation have been detected in the global observational networks (Wild, 2009; Wild et al., 2021), often coinciding with anthropogenic air pollution patterns (Nabat et al., 2014; Pfeifroth et al., 2018; Glantz et al., 2022). In Europe and Austria, three typical periods can be found in the observations: the ‘early brightening’ (1940s), the subsequent dimming (1950s to 1980s) and the still ongoing brightening phase (since the 1980s) (Manara et al., 2016; Kuhn and Olefs, 2020; Philipona et al., 2023).
In recent years, several studies have investigated and discussed the relative contributions of aerosol vs. large-scale circulation (i.e. cloudiness) changes in causing the current brightening phase in Central Europe (Sfîcă et al., 2021; Wild et al., 2021; Julsrud et al., 2022; Manara et al., 2023). Using satellite data, a recent study by Schilliger et al. (2024) attributes the increasing surface solar radiation in the periods 1983–2002 and 2001–2020 mainly to aerosol and cloudiness changes, respectively. The study by Ferreira Correa et al. (2024) points out that changes at low altitude stations are dominated by a strong clear sky forcing, in contrast to high altitude stations where changes are more related to cloud optical properties and surface albedo.
Based on data from twenty stations in Switzerland, the actual increase in net surface solar radiation is as much as 30 % greater than the observed increase in downward thermal longwave radiation due to increasing anthropogenic greenhouse gas concentrations in the atmosphere, which is the strongest regional-scale driver of climate change in central Europe since 1980 (Philipona et al., 2023). For Austria, surface solar radiation time series are currently being homogenized (Seitner et al., 2023) and downward thermal longwave time series have only been established since 2010 (Olefs et al., 2016).
Storminess
Existing studies show no long-term trend in past observed European storminess (extratropical storms with wind speeds of more than 75 km/h or 9 Beaufort) (Matulla et al., 2008, 2020; Feser et al., 2015).
1.2.2. Future changes
In the following, we present an overview of the projected changes in key climate indicators for Austria. These changes are driven by the interplay between large-scale changes in temperature and atmospheric circulation and local processes and feedbacks (Section 1.2). The projected changes in these processes are affected by various sources of uncertainty. Therefore, a discussion of projection uncertainties and the large-scale context of climate change in Austria is presented first. The indicators presented are, unless otherwise indicated, derived from the Austrian climate scenarios ÖKS15 (Chimani et al., 2016; Truhetz and Leuprecht, 2018; Chimani et al., 2019; Maraun et al., 2021), which are a bias-adjusted variant of a series of EURO-CORDEX simulations. Figures for a selection of indicators are shown below, with additional figures provided in the Appendix (Figures 1.A.4, 1.A.5, 1.A.6). Definitions of the indicators used in Chapter 1 are given in Table 1.A.1.
Uncertainties in regional climate projections
Climate projections are affected by three main sources of uncertainty (IPCC, 2021a): Forcing uncertainty, climate response uncertainty and internal variability. Forcing uncertainty refers to the fact that future climate forcings are inherently unpredictable. In particular, greenhouse gas emissions depend on current and future political, economic and social decisions. Therefore, a range of plausible concentration pathways and shared socio-economic pathways has been constructed to explore how different socio-economic developments may affect future climate. Uncertainty in climate response refers to the fact that we do not fully understand the climate system and also have limited computational resources to model it. This uncertainty is particularly important at the regional scale and for extreme events, and is influenced by global-scale uncertainty in climate sensitivity, uncertainties in changes in large-scale atmospheric circulation, and regional processes and feedbacks (Chen et al., 2021). A major contributor to uncertainty in climate response is tipping elements (see Chapter Box 1.2). Multi-model ensembles are used to capture uncertainty in climate response. However, these ensembles cannot fully quantify the uncertainty arising from systemic model bias, where model projections do not cover the true range of plausible future climate states.
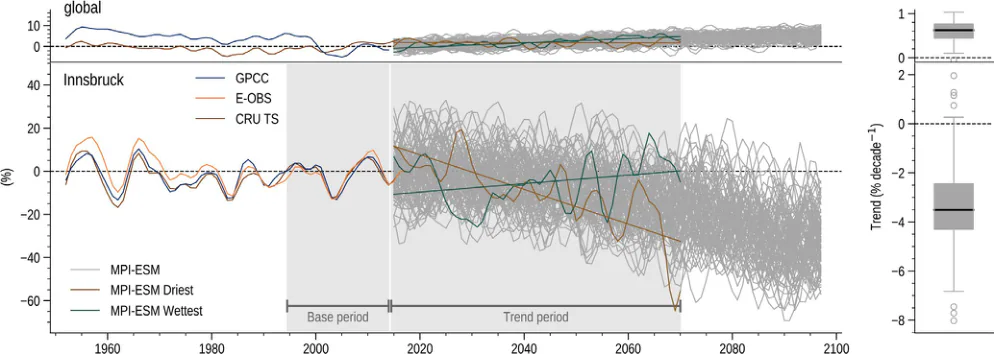
Also, internal variability is a major source of uncertainty at the regional scale (Figure 1.3). As a result, multidecadal trends at the local scale may be substantially different – stronger, weaker or even opposite – to those expected from increasing greenhouse gas concentrations (Doblas-Reyes et al., 2021). Initial condition ensembles have been used to sample uncertainties due to internal variability. In general, uncertainties are not fully sampled by climate models, i.e., they are larger than the simulated model spread (Doblas-Reyes et al., 2021). Global warming levels have been proposed to resolve uncertainties in global forcing and climate sensitivity by expressing changes relative to a given level of global mean temperature increase (Chapter Box 1.1).
Large-scale context of Austrian climate change
Global and European temperature and precipitation projections
For all emission scenarios considered by the IPCC, the global surface temperature will continue to rise until at least mid-century (high confidence) (IPCC, 2021a). Global warming of 1.5°C and 2°C will be exceeded during the 21st century unless deep reductions in CO2 and other greenhouse gas emissions occur in the coming decades (IPCC, 2021a). Assuming a continuation of current policies, anthropogenic greenhouse gas emissions are projected to lead to a median global warming of 2.7°C [2.2 to 3.4°C] by 2100 (Climate Action Tracker, 2024) (high confidence). In the worst-case scenario SSP5–8.5, the global mean surface temperature is projected to increase by 3.3 to 5.7°C (very likely range) in the period 2081–2100 compared to 1850–1900. Such increases would be associated with drastic changes in the climate system, including increased frequency and intensity of hot extremes, ocean heat waves, heavy precipitation, and, in some regions, agricultural and ecological droughts (IPCC, 2021a). Some tipping points are also likely to be crossed (see Chapter Box 1.2).
In Europe, mean temperatures are projected to increase more than the global average, as land surfaces warm faster than oceans (IPCC, 2021a). In winter, polar amplification causes the strongest changes towards the northeast, while in summer the strongest changes are expected over the Mediterranean. For the IPCC region Western Central Europe (WCS) to which Austria belongs, the annual mean changes from 1850–1900 to 2081–2100 under a worst-case scenario (SSP5–85) range from 5°C in the EURO-CORDEX ensemble to 5.8°C in the CMIP5 ensemble and 6.2°C in the CMIP6 ensemble. These changes are slightly higher in summer and lower in winter. Under a scenario compatible with the Paris Agreement (SSP1–2.6, with overshoot) these changes could be limited to values between 1.7°C (EURO-CORDEX), 1.9°C (CMIP5) and 2.0°C (CMIP6). Changes in EURO-CORDEX, and thus also in ÖKS15, are likely to be underestimated because several models may not have included changes in greenhouse gas concentrations in the European domain (Jerez et al., 2018).
Regional changes in precipitation are determined by the interplay of the Clausius-Clapeyron relationship (warmer air can hold about 7 % more water vapor) and regional changes in atmospheric circulation (Pfahl et al., 2017; Ritzhaupt and Maraun, 2024). As a result, a strong north-south gradient over Europe is expected: Mean precipitation is projected to increase in northern Europe and decrease in southern Europe. Although the exact location of the transition zone is uncertain, it robustly shifts to the north in summer and to the south in winter (Ritzhaupt and Maraun, 2023). On an annual average, Austria is close to this transition zone.
Weather patterns and storm projections over the Atlantic and Europe
As discussed in Section 1.2.1, regional climate and weather extremes in Austria are also controlled by large-scale weather patterns. In winter, the North Atlantic jet is projected to strengthen over the Atlantic and slightly expand into Europe (Harvey et al., 2020). These jet changes are associated with a strengthening of the North Atlantic storm track and its slight expansion into Europe. In the summer, the North Atlantic jet is expected to shift northward, associated with a weakening and slight northward shift of the storm track (Harvey et al., 2020).
In the winter season, climate models project a strong increase in the number of days with a positive North Atlantic Oscillation (NAO), a slight increase in the number of days with a negative NAO, and a significant decrease in the number of days with both Scandinavian blocking and the North Atlantic Ridge (Woollings et al., 2018; Davini and D’Andrea, 2020; Fabiano et al., 2021). The persistence of positive NAO regimes is projected to increase slightly, that of negative NAO to remain constant, and that of the Scandinavian blocking and the North Atlantic Ridge to decrease slightly (Fabiano et al., 2021; Dorrington et al., 2022). A slight decrease in the number of blocked days is also projected for summer (Woollings et al., 2018; Davini and D’Andrea, 2020). There are no studies on changes in the persistence of summer blocking. The frequency of cut-off lows over Europe is projected to increase slightly, with long-lasting events showing a substantial increase in spring and summer (Mishra et al., 2025).
All of the changes described above characterize the average changes across the CMIP climate model ensembles. Simulated changes for individual models may be much stronger, and for weak multi -model mean changes they may even be of opposite sign. Overall, there is only medium confidence in changes in atmospheric circulation, and they represent a large source of uncertainty in regional climate change (Shepherd, 2014; Doblas-Reyes et al., 2021).
Various regional feedbacks, including soil moisture-temperature coupling and snow-albedo feedbacks, can further amplify or dampen regional climate changes (Doblas-Reyes et al., 2021).
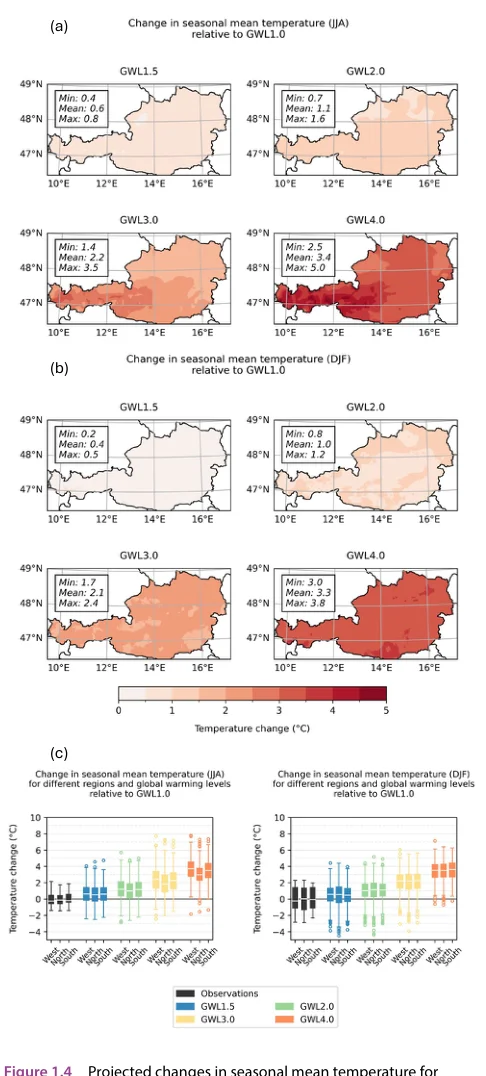
Temperature projections
Consistent with our physical understanding, seasonal mean temperatures over Austria are clearly projected to increase for all seasons with increasing levels of global warming (high confidence), based on simulations with CMIP3, 5 and 6 global climate models (Meehl et al., 2007; IPCC, 2014b; Lee et al., 2021), and the regional climate models PRUDENCE, ENSEMBLES and EURO-CORDEX (Christensen and Christensen, 2007; van der Linden and Mitchell, 2009; Jacob et al., 2014). These changes are most pronounced over high terrain, as can be seen for the ÖKS15 simulations (see Figure 1.4, see also Section Elevation dependencies). These changes are also higher than the global mean, mainly due to the stronger warming over land.
In addition to the warming that happened in Austria up to GWL 1.0°C (which occurred in the period 2001–2020), annual mean temperatures are expected to rise by 0.54°C, 1.08°C, 2.19°C and 3.36°C (average of the ÖKS15 ensemble at GWL 1.5°C, GWL 2.0°C, GWL 3.0°C, and GWL 4.0°C, respectively). Mean temperatures are projected to further increase in all seasons with increasing levels of global warming. At GWL 4.0°C, the warming is strongest in summer (+3.4°C), fall (+3.4°C), and winter (+3.3°C), and slightly weaker in spring (+2.7°C) according to the ÖKS15 simulations (Truhetz and Leuprecht, 2018) (Figure 1.4 and Figure 1.A.4).
These changes are accompanied by an increase in heat stress, indicated by a higher number of hot days and tropical nights (Figure 1.5), and a reduction in cold stress, exemplified by a reduced number of ice days and extreme ice days.
As a result of rising mean temperatures, the length and severity of heat waves are also projected to increase. Changes in heat extremes tend to be stronger than changes in mean temperatures because of an increase in temperature variability over central Europe in response to a strengthening of the soil moisture-temperature coupling (Seneviratne et al., 2006; Fischer et al., 2012). Overall, there is high confidence that heat extremes in Austria will become more severe in a warming climate. For example, the number of hot days in a very hot year occurring once in 10 years in the past (climate period 1961–1990) will likely multiply by 3.5 GWL 1.5°C, by 4.3 at GWL 2.0°C, by 5.7 at GWL 3.0°C, and even by 8.1 at GWL 4.0°C on average for Austria. In addition, the average temperature of heat waves will likely increase by 6.6°C at GWL 4.0°C compared to the climate period 1961–1990 (robust evidence, low agreement).
In response to rising temperatures, the vegetation period is projected to start earlier and become longer. The relevance of temperature changes for glacier and permafrost retreat is discussed in Section 1.3.
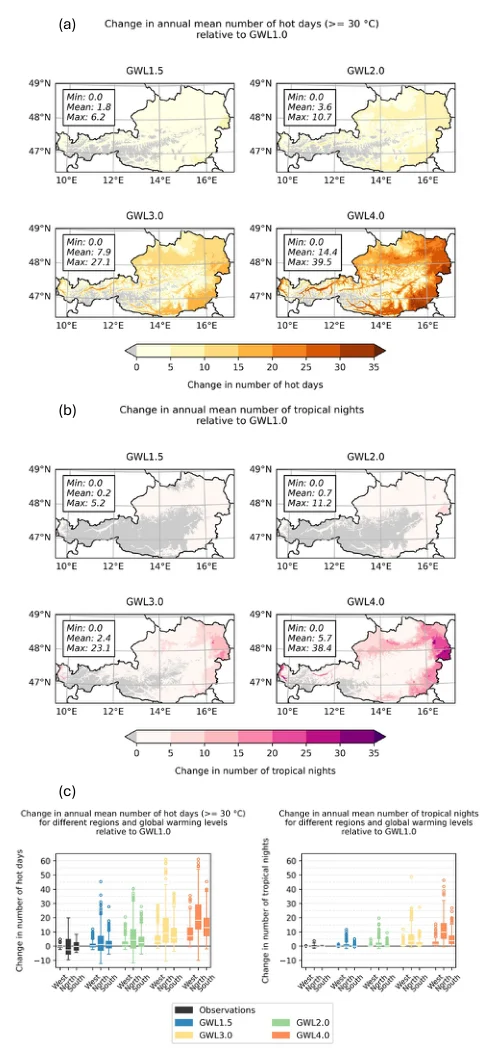
Precipitation projections
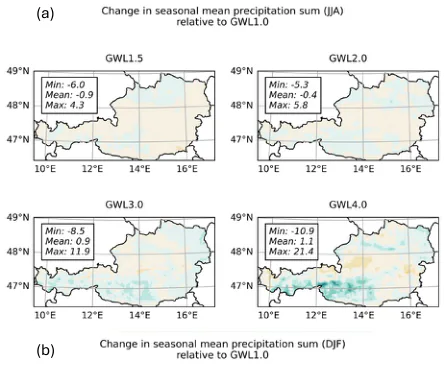
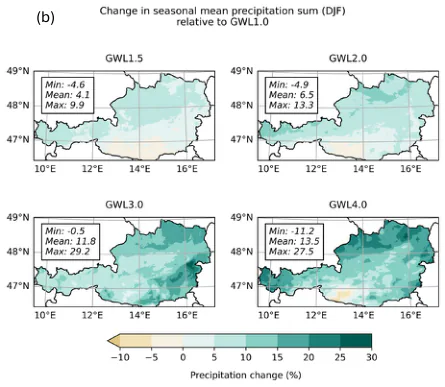
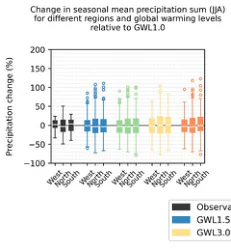
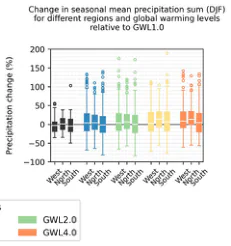
As Austria is located in the transition region between the drying trends of the Mediterranean and the wetting trends of northern Europe, projections are affected by considerable uncertainties depending on the season.
For total annual precipitation, older ENSEMBLES models do not agree on the projected changes over Austria, nor are these changes significant (Jacob et al., 2014). However, the EURO-CORDEX ensemble projects an increase in total annual precipitation (Jacob et al., 2014; Haslinger et al., 2023).
For both winter and summer, projections of seasonal mean precipitation are robust across a range of different global and regional climate model ensembles (Jacob et al., 2014; Rajczak and Schär, 2017; Kotlarski et al., 2023; Ritzhaupt and Maraun, 2023). While most models simulate an increase in winter, a decrease is projected for summer (with some EURO-CORDEX models also showing significant increases). The decrease in summer is confirmed by ensemble projections with convection-permitting regional climate models (Pichelli et al., 2021). In both seasons, however, the contribution of internal variability is strong and may reverse the expected future trends for the next decades (Maraun, 2013). For spring and fall, there is no clear signal, and internal climate variability dominates (Maraun, 2013). Overall, there is high confidence for an increase in winter precipitation and medium confidence for a decrease in summer precipitation over Austria. These changes are clearly evident under high emission scenarios or global warming levels. Figure 1.6 illustrates these changes as projected by the ÖKS15 ensemble.
The number of wet days does not show a clear change signal in winter, spring and fall, but for summer many models agree on a reduced number of wet days under strong warming (Rajczak and Schär (2017): -10 % to -25 % based on ENSEMBLES and EURO-CORDEX; Pichelli et al. (2021): -4 % to -10 % based on CORDEX-FPS convection-permitting regional climate models, multi-model means for RCP8.5).
Changes in mean precipitation are also reflected in changes in extreme precipitation. Multi-model means for RCP8.5 daily precipitation intensities are projected to increase in winter (up to 25 %), spring and fall (up to 20 %), and with a similar but weaker trend in summer (up to 15 %), based on ENSEMBLES and EURO-CORDEX (Rajczak and Schär, 2017). Extremes of daily precipitation are projected to increase in all seasons, though the strength of the signal varies considerably across the considered ensemble (as shown in Figure 1.7) and indicator (Rajczak and Schär, 2017; Ritzhaupt and Maraun, 2023). For summer, coarse-resolution climate models simulate a decrease in extreme precipitation, but there is evidence that their resolution is too coarse to represent topographic influences on convection, making their simulated changes implausible (Giorgi et al., 2016; Ritzhaupt and Maraun, 2023). Overall, there is medium to high confidence for an increase in extreme daily precipitation for winter, spring, and fall, and medium confidence for summer.
For extreme rainfall over 5-day periods, there is a clear signal for strong warming in winter (up to 25 %), spring, and fall (up to 20 %) (medium confidence), and no signal for summer (RCP8.5, multi-model means from ENSEMBLES and EURO-CORDEX) (Rajczak and Schär, 2017).
Newly available convection-permitting climate models with kilometer-scale resolution (Coppola et al., 2020) were evaluated for changes in hourly precipitation extremes for summer and fall (Pichelli et al., 2021). These models project higher intensities and extremes for both seasons (with a slight decrease in summer extremes over the eastern lowlands). However, the number of rainfall hours is projected to decrease in summer and fall (with a slight increase in the northeast). These results are broadly consistent with changes simulated by the driving EURO-CORDEX regional climate models, but have not been assessed for significance or robustness. Pseudo-global warming studies (e.g., Doblas-Reyes et al., 2021) of a single event suggest the possibility of a super-Clausius Clapeyron dependence (relative to global temperature increase) of extreme short-term summer rainfall, but this may be counteracted by a possible stabilization of the atmosphere (Maraun et al., 2022). Given the limited evidence, the lack of full physical interpretation, and the absence of uncertainty assessment, confidence in the projected increase in hourly rainfall extremes in summer and fall is currently low.
There has been little research on severe convective storms over Europe such as mesoscale convective systems and supercells, which can, in turn, cause hailstorms and tornadoes. One reason is the limited availability, until recently, of climate simulations representing such storms. As a way out, Brooks (2013) and Allen (2018) suggest the analysis of large-scale atmospheric environments conducive to such storm events, i.e., high instability and low-level moisture as well as strong deep-layer wind shear. EURO-CORDEX simulations at 0.44° grid spacing project a robust increase in such environments under strong warming, except at high altitudes, due to an increase in low-level moisture (Púčik et al., 2017). Chan et al. (2023) analyzed projections of mesoscale convective systems over Europe in two convection-permitting models and found inconsistent changes in frequency, magnitude, and velocity, but a consistent increase in peak intensity, total precipitation volume, and temporal clustering.
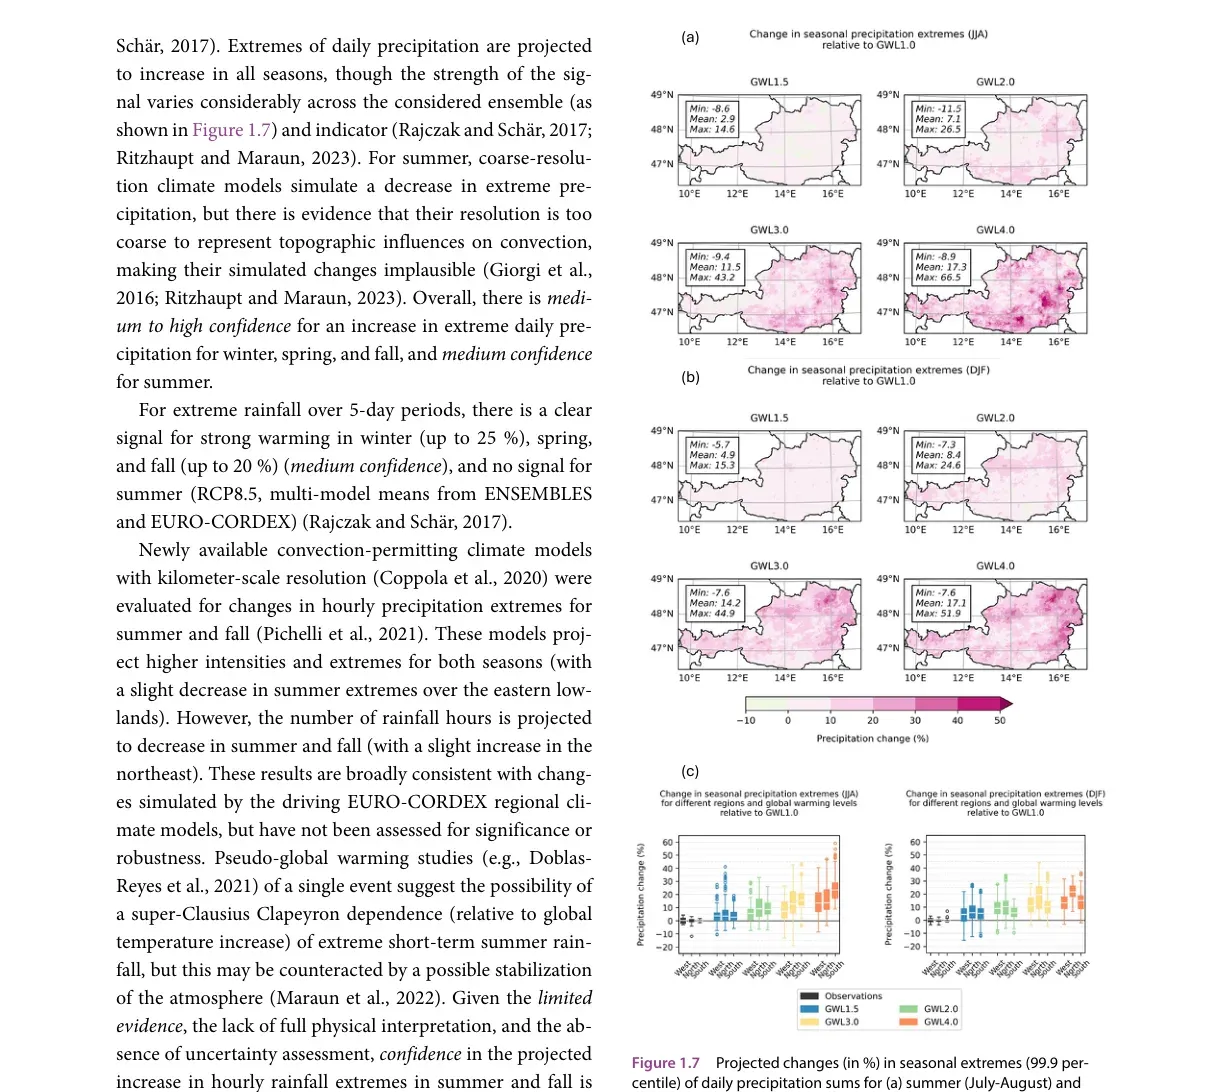
Text of the graphic
Figure 1.7 Projected changes (in %) in seasonal extremes (99.9 percentile) of daily precipitation sums for (a) summer (July-August) and
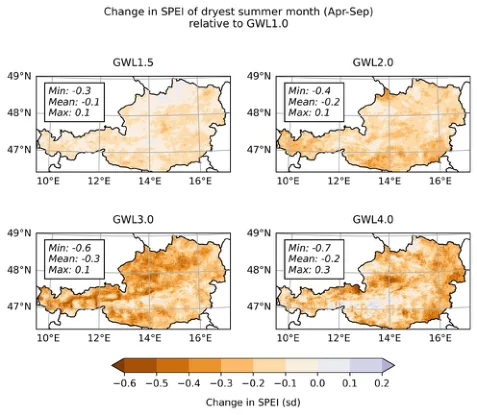
Drought projections
A simple and easy-to-interpret indicator of meteorological drought is the number of consecutive dry days within a season or year. For winter, there is no change in this indicator, but for summer, a robust increase is found in EURO-CORDEX simulations (Dosio, 2016).
Soil moisture or agricultural drought takes into account the drying of the soil caused by a lack of precipitation and strong evapotranspiration due to high temperatures. A study based on two hydrological and two land surface models driven by the CMIP5 global climate model ensemble shows an increase in the duration of extreme soil moisture drought events (from 30 to more than 100 months) and the average number of drought months (from 2–3 to 3–5 months per year) under 3°C warming (Samaniego et al., 2018). The latter changes are particularly large for eastern Austria. Similar results are found in other studies using the regional climate models ENSEMBLES and EURO-CORDEX (Heinrich and Gobiet, 2012; Haslinger et al., 2016; Spinoni et al., 2018; Haslinger et al., 2023). The driving factor for these robust changes is rising temperatures. Overall, there is high confidence for more severe agricultural droughts with global warming over Austria. Figure 1.8 shows the projected changes in the standardized precipitation-evapotranspiration index (SPEI) based on the ÖKS15 ensemble. The SPEI indicator shows negative values for all GWLs in the summer half-year, which corresponds to an increase in dry periods.
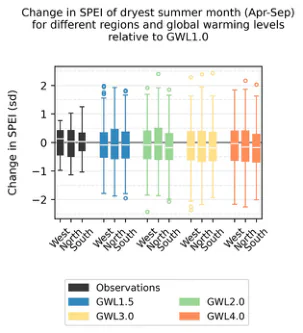
Wind projections
Wind is a variable that directly represents atmospheric dynamics, and projections are therefore affected by high uncertainties. These uncertainties are exemplified by a wide range of plausible changes simulated for winter wind speed over Austria, including no change or a significant increase depending on the actual large-scale circulation changes (Zappa and Shepherd, 2017).
For the annual mean, no robust signal in wind speed changes is found in the EURO-CORDEX projections (Wohland, 2022). Consistent with this, Tobin et al. (2016) find a wide range of possible changes in the annual mean wind energy yield. Similar results are found for wind energy output, where two models suggest no change (Hueging et al., 2013) and an ensemble of nine combinations of two RCMs and five GCMs projects a slight decrease (Moemken et al., 2018). The latter results vary over the seasons, with a consistent decrease in summer. Uncertainties are high for projections of sub-daily wind variability, although they tend to increase with strong warming. Monthly variability is projected to increase (Tobin et al., 2016).
For wind extremes, Outten and Sobolowski (2021) find a slight increase in 30-year return periods in the EURO-CORDEX simulations, but without explicit uncertainty assessment. An earlier study found a strong dependence of extreme wind gust projections on the driving GCM, with no robust signal emerging (Nikulin et al., 2011).
Only one study has analyzed climate projections for foehn winds in the Alps (Maier et al., 2025). In the EURO-CORDEX simulations, the frequency of southern foehn events over Tyrol is projected to decrease slightly, while widespread events are projected to increase in both Tyrol and Vorarlberg. A seasonal shift from July to October into the spring months is projected.
Elevation dependencies
Climate change is known to be elevation dependent (Pepin et al., 2022) (see also Section 1.2.1 for observations). In both ENSEMBLES (Kotlarski et al., 2015) and EURO-CORDEX (Kotlarski et al., 2023), the warming rates have a maximum between about 1,500–2,000 m in spring and between about 2,000–2,500 m in summer. For winter, the warming rate saturates above 1,500 m, and for fall, the warming rate increases with elevation up to the resolved altitude. However, a comparison of global climate model simulations with resolutions varying from about 16–125 km found a strong but unsystematic dependence of the existence and strength of elevation-dependent warming on model resolution (Palazzi et al., 2019). These findings highlight the associated uncertainties.
Precipitation projections in the ENSEMBLES simulations also show a clear elevation dependence, but with strong regional and seasonal variations (Kotlarski et al., 2015). For the Eastern Alps, positive trends decrease with altitude and negative trends increase.
Not surprisingly, the number of snow days (Kotlarski et al., 2015) and snow water equivalent (Kotlarski et al., 2023) show clear elevation-dependent changes (high confidence based on simulations and physical understanding). Decreases in the number of snow days are greatest at intermediate elevations of about 1,000 m in winter, 1,500 m in spring, and 2,000 m in summer and fall. Decreases in snow water equivalent from September to May are higher at lower elevations. For low warming, almost no decrease is found above 2,500 m, while for high warming levels, significant decreases are found at all elevations.
Changes in snow are discussed in more detail in Section 1.3.1.
Chapter Box 1.1. Global warming levels and their implications for Austria
Concept and method in AAR2
Since the adoption of the Paris Agreement in 2015, the global and regional implications of a 1.5°C or a 2.0°C warmer world gained traction in the public, political and scientific debate. In its Special Report on Global Warming of 1.5°C (IPCC, 2018), the IPCC assessed a range of climate change impacts at these two levels of global mean surface temperature (GMST) increase. In the sixth Assessment Report cycle, global warming levels (GWLs) are used as a ‘robust and useful dimension of integration’ (Chen et al., 2021) for comparing climate studies across many scientific disciplines and beyond.
This integrative property of GWLs stems from a different way of looking at climate projections. Most model-based climate projections are derived from models that simulate the climate system and its interactions on a global scale. Conventionally, climate change and its impacts are categorized in terms of time periods (e.g., mid-century) and underlying greenhouse gas (GHG) emission scenarios outlined in the IPCC Special Report on Emissions Scenarios (SRES) (Nakićenović et al., 2000), representative concentration pathways (RCPs) (Van Vuuren et al., 2011), or shared socio-economic pathways (SSPs) (Riahi et al., 2017). GWLs, on the other hand, are defined as a point in time when GMST exceeds a certain threshold relative to a (most often pre-industrial) reference period, as illustrated in Figure 1.A.1. All subsequent analyses refer to this period. The main difference to the conventional approach is that the same GWL can include model results from different time periods, emission or concentration scenarios. In a sense, the GWL perspective bypasses the uncertainties associated with the underlying forcing scenarios and model-internal climate sensitivity and looks directly at the resulting global temperature change.
The GWLs concept also involves some inherent assumptions and shortcomings. These are discussed extensively in the literature (e.g., James et al., 2017) but a few examples are presented here. First, while a number of regional climate impacts have been shown to be linearly related to GMST and therefore well represented by GWLs (Wartenburger et al., 2017; Seneviratne et al., 2018b; Lewis et al., 2019; Tebaldi et al., 2020; Iyakaremye et al., 2021), showing changes in terms of GWLs can mask substantial differences between variables with a strong dependence on local or regional aerosol concentrations, such as mean precipitation or local precipitation extremes (McCoy et al., 2022; Persad et al., 2022). Second, the transient (warming) or equilibrium (stabilized) state of the climate at a given GWL can lead to substantially different regional and local climate conditions (Seneviratne et al., 2018a; King et al., 2020, 2021; Zhang and Zhou, 2021). However, because equilibration occurs on centennial timescales (Rugenstein et al., 2019), transient behavior is more relevant to impact studies, and the AAR2 therefore only considers the 20-year period in which a global temperature threshold is first crossed. This, in turn, limits the ability to represent slow-changing or delayed impacts, such as glacial retreat, purely in terms of GWLs. In a few cases throughout AAR2, such impacts are therefore additionally characterized by time periods or forcing scenarios.
Details of the method used to identify GWLs from global climate model output are presented in Becsi and Formayer (2024). The main GWLs throughout the AAR2 are 1.5°C, 2.0°C, 3.0°C and 4.0°C of GMST increase relative to 1850–1900. Where study results were available only for predetermined periods, the approach was reversed to calculate discrete GWLs for the respective periods. GWL periods for the most commonly used models are provided in Table 1.A.2.
The shift to CMIP6
While the ÖKS15 climate scenarios were based on regional climate models forced by global climate models of the fifth coupled model intercomparison project cycle (CMIP5) (Taylor et al., 2012), global models of the newer generation CMIP6 (Eyring et al., 2016) have now been released. It will be years before local climate scenarios downscaled from the CMIP6 GCM/RCM chain are available1. However, Becsi and Formayer (2024) have shown with the Austrian climate scenarios ÖKS15 that GWLs are well suited to represent temperature changes at the regional scale, and that generational shifts in global climate models can be accounted for using the GWLs concept. There are two main conclusions of the study:
- Warming trends for future periods are significantly higher in CMIP6 than in CMIP5, and therefore future GWLs are reached earlier in CMIP6 than in CMIP5. This acceleration amounts up to a decade between the CMIP5 and CMIP6 ensemble medians at GWL 4.0°C, and less at lower GWLs.
- Since models usually either over- or underestimate temperature trends, the related errors in absolute temperatures can accumulate over time. Because the GWL concept characterizes climate projections on the basis of a silimar climate instead of similar timing, it can adjust for this type of error in downstream scenario analysis.
The initiative ‘Klimaszenarien.AT’ is currently developing new Austrian climate scenarios. See klimaszenarien.at for more information.
Box 1.1 Figure 1 supports these findings. It shows the differences in timing between CMIP5 and CMIP6 in reaching a given GWL (a) and the differences in regional temperature signals at that GWL (b). The baseline for all changes is GWL 1.0°C rather than a fixed time period. As the figure shows, the GWL concept accounts for the different warming rates in the models and selects periods in such a way that regional temperature changes between GWLs are quite stable across model generations in Austria.
This approach of relating changes to GWLs instead of reference periods is adopted in the following sections, so that these changes can be assumed to be valid also in light of the transition from CMIP 5 to CMIP6. This underlines the integrative capacity of the GWLs concept to compare climate impacts across time periods, emissions scenarios and even model generations.
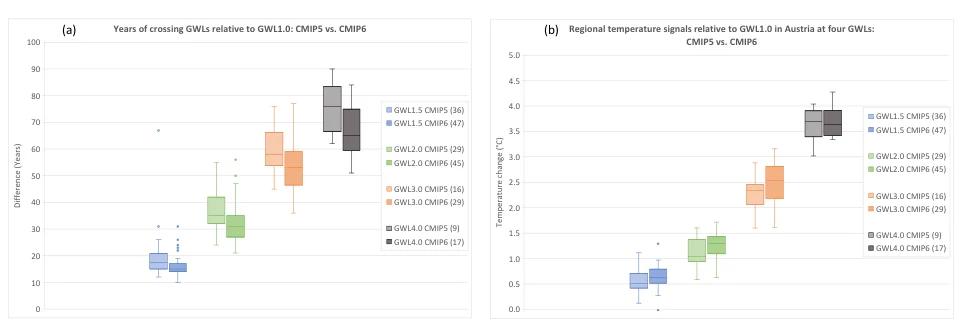
Text of the graphic
(a)
Years of crossing GWLs relative to GWL1.0: CMIP5 vs. CMIP6
Difference (Years)
0
10
20
30
40
50
60
70
80
90
100
(b)
Regional temperature signals relative to GWL1.0 in Austria at four GWLs: CMIP5 vs. CMIP6
Temperature change (°C)
0.0
0.5
1.0
1.5
2.0
2.5
3.0
3.5
4.0
4.5
5.0
GWL1.5 CMIP5 (36)
GWL1.5 CMIP6 (47)
GWL2.0 CMIP5 (29)
GWL2.0 CMIP6 (45)
GWL3.0 CMIP5 (16)
GWL3.0 CMIP6 (29)
GWL4.0 CMIP5 (9)
GWL4.0 CMIP6 (17)
The cold bias in ÖKS15
Recent warming trends are underestimated in the ÖKS15 ensemble. Since the downscaling approach applied in the scenario development (Switanek et al., 2017) preserves the change signals of the EURO-CORDEX models in the background, this cold bias is rooted in the RCMs and has also been identified in the literature (Kjellström et al., 2018; Schumacher et al., 2024).
It is further exacerbated by the fact that the period chosen to adjust the bias in the raw EURO-CORDEX models with observational data is 1971–2000, which is 20 years behind the current climate normal period (World Meteorological Organization (WMO), 2017). The cold bias in the model trends has therefore accumulated over time to a significant gap compared to the current observed warming.
Box 1.1 Figure 2 illustrates the lagged warming of the ÖKS15 scenarios compared to observations (reference period 1971–2000). This period is relevant for all applications that use the absolute values of the ÖKS15 temperature data. All temperature values are averaged over the area of Austria and the respective year. The reference point for the observed warming is the year 2024. It is calculated from annual observations using a 41-year LOESS filter (Clarke and Richardson, 2021), since the common approach of using averages of climate normal periods lags at least 15 years (for 30-year periods) behind current climatic conditions. The LOESS filter approach is better suited to represent recent warming. The same filter function was applied to the ÖKS15 temperature data. The figure highlights the temporal perspective of the cold bias rooted in ÖKS15: Current (2024) temperature levels are reached in 2050 in the ensemble median of RCP8.5 and in 2065 in the ensemble median of RCP4.5. The delay is 27 years (RCP8.5) and 42 years (RCP4.5), respectively. Almost all models in RCP2.6 are below recent levels of temperature increase by 2100.
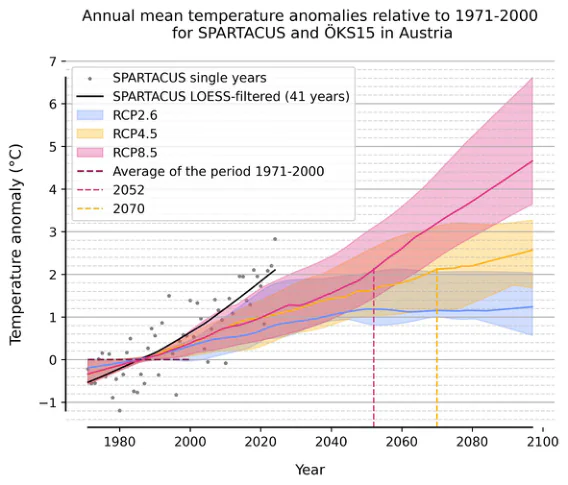
To mitigate errors accumulated over the past 40 years since the period used for bias-adustment, model trends can be compared against more recent observational data. Though even when relating changes to the current climate normal period (1991–2020), almost no model in the RCP2.6 ensemble reaches the observed temperature level of 2024 until 2100. By relating the changes to GWL 1.0°C instead of a fixed reference period, the resulting adjustment (see Section The shift to CMIP6) significantly reduces the delay to observed levels of warming.
As a guideline for interpreting ÖKS15-based climate studies in the light of this cold bias, Figure 1.A.2 quantifies the time lag of all ÖKS15 models for commonly used reference periods as well as for GWL 1.0°C. The corresponding data are shown in Table 1.A.3.
There are some general recommendations for handling the cold bias in ÖKS15 in future climate change studies. Foremost, it makes sense to minimise the period over which past errors accumulate by selecting an observational reference period as close to the current climate as possible, and only evaluating future model trends from that point on. In light of the recent warming rate of 0.6°C per decade in Austria, 30-year periods might be too long for averages to represent stationary conditions, and 20-year periods might be better suited for that purpose.
Where feasible, relating changes to GWLs instead of determined periods can reduce the timing-sensitive part of the error and has the benefit of being robust across model generations. However, there are cases where climatological averages do not provide the right scope. Some impact models require transient data on (sub)daily time scales as input. These cases could still benefit from the trend-adjusting properties of the GWLs concept, for example when time series are initialised at a given GWL rather than a fixed time period for each input model. Although the GWLs perspective provides a helpful way to maintain the usefulness of the ÖKS15 climate scenarios for the coming years, the issue of underestimated warming trends can ultimately only be addressed with the release of the next generation of Austrian climate scenarios.
Chapter Box 1.2. Tipping points in the climate system
What are tipping points?
The IPCC defines a tipping point as a critical threshold beyond which a system undergoes a significant and often abrupt or irreversible reorganization into a new state. A tipping element, in turn, refers to ‘a component of the Earth system that is vulnerable to reaching such a tipping point’ (Chen et al., 2021). Tipping points are characteristic of systems with amplifying feedbacks, where small disturbances can lead to disproportionately large responses. Moreover, once an irreversible tipping point is crossed, the system does not return to its previous state, even if the original forcing is reversed.
As early as the 2000s, the IPCC cautioned that tipping points could be reached within the coming centuries if greenhouse gas emissions continued to increase (IPCC, 2001). However, more recent evidence suggests that these thresholds could be crossed at lower levels of warming and much sooner – possibly within this century – raising the risk of cascading effects that could impact other critical components of the climate system (Möller et al., 2024).
Tipping points are identified through expert judgement that integrates observational data, paleoclimatic evidence, and Earth system model simulations. This evaluation is complemented by an assessment of the feedback mechanisms specific to each tipping element, the global temperature thresholds that could trigger them, their potential irreversibility, the timescales of their transitions, and their likely global and regional impacts (Lenton et al., 2008; Armstrong McKay et al., 2022). Based on these criteria, tipping points have been identified in the biosphere, cryosphere, and ocean-atmosphere systems (see Box 1.2 Table 1).
While tipping points have occurred in the past without human influence – such as the abrupt climate shift 11,700 years ago that marked the beginning of the Holocene epoch – this report focuses on tipping elements that are vulnerable to human activities, including greenhouse gas emissions and land-use change, that have the potential to influence the global climate system. Given Austria’s integration into the global climate and societal system, any tipping point affecting the planets’ climate is likely to have an impact on the country.
Below, we introduce two tipping elements that could greatly impact Austria. Box 1.2 Table 1 provides a summary of the major climate tipping points identified to date, along with their associated global temperature thresholds. These tipping elements have the capacity to cause profound disruptions to Earth’s systems and human societies.
Tipping elements with potentially high impacts on Austria
A collapse of the Atlantic Meridional Overturning Circulation (AMOC)
The AMOC is a critical ocean current system that regulates climate patterns globally. Its surface branch transports warm, salty water northward, while its deep branch transports cold water southward. This circulation is primarily driven by deep water formation, which occurs when surface water cools and sinks in the northern Atlantic.
The AMOC is vulnerable to climate change, as rising temperatures slow the cooling of surface water, weaken deep water formation, and reduce the strength of the current. Evidence suggests that the AMOC has weakened by about 15 % since the mid-20th century (Caesar et al., 2018; Thornalley et al., 2018), with further declines projected by Earth system models, including those from the CMIP projects (Weijer et al., 2020).
Paleoclimate records and theoretical and modeling studies suggest that the AMOC may be reaching a tipping point. Stommel (1961) proposed that the stability of the AMOC depends on the delicate balance between the effects of temperature and salinity on water density. Currently, the system is primarily temperature driven, with cold water in the northern latitudes maintaining a strong AMOC. However, a significant influx of freshwater – resulting from accelerated melting of the Greenland ice sheet or increased precipitation – could disrupt this balance, increasing the risk of AMOC collapse.
While most current climate models do not predict a complete AMOC shutdown during the 21st century, some projections suggest that a collapse could occur before 2300 if greenhouse gas emissions continue to increase (Bakker et al., 2016). A recent study, based on a single model, simulated an AMOC collapse and identified the processes that unfolded both near and during the tipping event. By comparing the tipping ‘fingerprints’ identified by the model with reanalysis data, the authors concluded that a tipping event could occur within this century (Van Westen et al., 2024). However, the temperature threshold for such a collapse remains highly uncertain, with considerable variability among model projections. An AMOC collapse would have profound consequences, including substantial cooling in the North Atlantic and Europe, disrupted rainfall patterns, and stronger winter storms, positioning the AMOC as a low-probability but high-impact tipping point in the near future.
Collapse of the Greenland Ice Sheet (GIS)
The GIS is shrinking at an accelerating rate due to increased surface melting and increased ice calving into the ocean, both driven by rising global and regional temperatures (IPCC, 2019b). Although complete melting of the GIS is unlikely to occur abruptly and would take at least the entire millennium, there is strong evidence that the GIS may be approaching – or may have already passed – a critical tipping point beyond which its melting could become irreversible (Höning et al., 2023). This process is strongly influenced by feedback mechanisms, with elevation feedback playing a key role. As the ice sheet melts and loses elevation, its surface becomes more exposed to the warmer temperatures at lower altitudes, further accelerating the rate of melting.
The complete melting of the GIS would result in a global sea level rise of about 7.2 meters, with far-reaching consequences, including potential disruptions to ocean and atmospheric circulation patterns that could significantly affect Europe (IPCC, 2019b).
* SPG: Subpolar Gyre
Earth system domain | Proposed climate tipping element and (tipping point) | Threshold (°C) | Timescale (years) | Maximum impact (°C) | |||||
|---|---|---|---|---|---|---|---|---|---|
Best Estimate | Min. | Max. | Best Estimate | Min. | Max. | Global | Regional | ||
CR | Greenland Ice Sheet (collapse) | 1.5 | 0.8 | 3.0 | 10k | 1k | 15k | 0.13 | 0.5 to 3.0 |
CR | West Antarctic Ice Sheet (collapse) | 1.5 | 1.0 | 3.0 | 2k | 500 | 13k | 0.05 | 1.0 |
CR | East Antarctic Subglacial Basins (collapse) | 3.0 | 2.0 | 6.0 | 2k | 500 | 10k | 0.05 | ? |
CR | Arctic Winter Sea Ice (collapse) | 6.3 | 4.5 | 8.7 | 20 | 10 | 100 | 0.60 | 0.6 to 1.2 |
CR | East Antarctic Ice Sheet (collapse) | 7.5 | 5.0 | 10.0 | ? | 10k | ? | 0.60 | 2.0 |
BI | Labrador-Irminger Seas/ SPG* Convection (collapse) | 1.8 | 1.1 | 3.8 | 10 | 5 | 50 | -0.5 | 3.0 |
BI | Atlantic Meridional Overturning Circulation (collapse) | 4.0 | 1.4 | 8.0 | 50 | 15 | 300 | -0.50 | -4 to -10 |
AO | Amazon rainforest (dieback) | 3.5 | 2.0 | 6.0 | 100 | 50 | 200 | Partial 0.1 Total 0.2 | 0.4 to 2.0 |
AO | Boreal Permafrost (collapse) | 4.0 | 3.0 | 6.0 | 50 | 10 | 300 | 0.2 to 0.4 | -- |

Text of the graphic
High confidence
Medium confidence
Low confidence
Chapter Box 1.3. Case study: Lake Neusiedl as sentinel of climate change
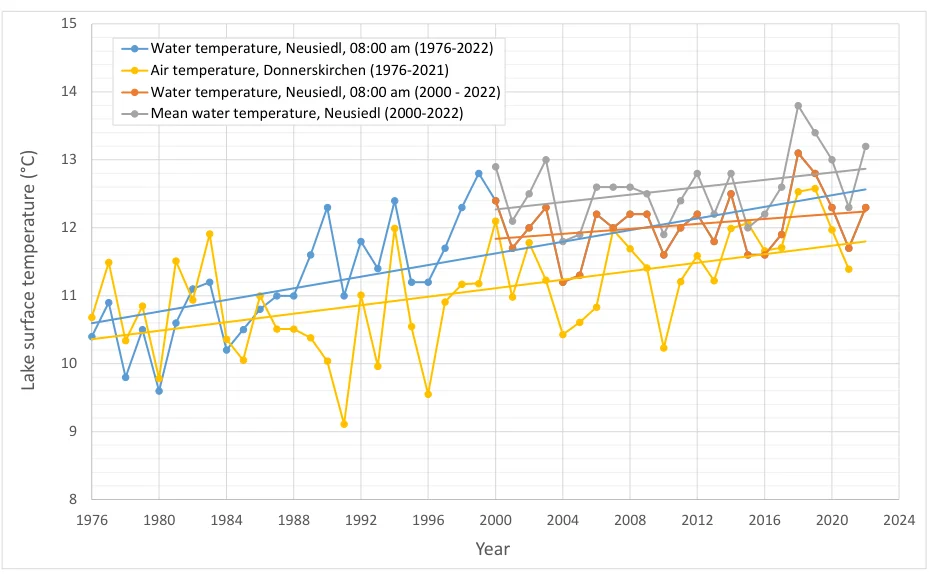
Text of the graphic
Water temperature, Neusiedl, 08:00 am (1976-2022)
Air temperature, Donnerskirchen (1976-2021)
Water temperature, Neusiedl, 08:00 am (2000 - 2022)
Mean water temperature, Neusiedl (2000-2022)
Lake surface temperature (°C)
Year
Lake Neusiedl, Austria’s largest lake, is exposed to wind, extremely shallow, and is currently losing substantial amounts of lake water due to rising air temperatures that increase evaporation. Large floods and several droughts have been recorded at Lake Neusiedl in the past, and it last dried up in 1865–1868 (Draganits et al., 2022). Unlike other lakes in Austria, Lake Neusiedl receives most of its water from direct precipitation and is disconnected from groundwater inflow (Tchaikovsky et al., 2019). Thus, the current loss of lake water is mainly the result of water evaporation due to high temperatures (Box 1.3 Figure 1) and decreasing precipitation. Compared to its average, long-term (since 1965) lake surface water level of ~115.5 m a.s.l., Lake Neusiedl in 2022 was ~10–50 cm below this long-term average water level2 (high confidence).
Ongoing climate change will have a major impact on the future of Lake Neusiedl and its surrounding ecosystems. Current climate change models, such as the ÖKS15 for Burgenland, show that lower average water levels can be expected, especially during the summer months. This applies not only to Lake Neusiedl, but also to neighboring water bodies such as the soda pans. The maximum water temperatures of Lake Neusiedl have continued to increase and often exceed 30°C in summer. Therefore, higher evaporation rates are to be expected with as yet unknown effects on the biocoenosis.
wasser.bgld.gv.at/hydrographie/die-seen/mittler-wasserstand-neusiedler-see
1.3. Cryosphere
This chapter focuses on the description of the Austrian cryosphere, including the regional/temporal occurrence, drivers, and magnitude of historical and future changes in response to climate forcing. Interactions and impacts on other natural and socio-economic systems are briefly mentioned, but as the perennial cryosphere in Austria is limited to high elevations, the broader context of the relevance of the cryosphere and the impacts of its change are discussed in Chapter 7.
1.3.1. Snow
Snow plays an important role in Austria, as its extent and duration are relevant for soil moisture, river flow characteristics, landscape appearance, and winter tourism. These factors in turn influence regional ecology, economy, agriculture and forestry (drought risk, forest fire risk), vegetation distribution, reservoir recharge, flood risk, snow avalanche and snow load risk, and hydropower yield.
Observed snow depth and snow cover duration
There is a growing body of literature on observed trends in snow-related indicators in the Alpine region, including Austria. For example, Klein et al. (2016) analyzed Swiss station data for the period 1970–2015 and found an average reduction in snow cover duration (SCD) of 8.9 days per decade. Schöner et al. (2019) found stronger negative trends in snow depth (SD; up to -12 cm per decade) in the southern parts of the Alps than in the northern parts between 1961 and 2012. This is also confirmed by Bozzoli et al. (2024), who evaluated snowfall depth over the European Alps between 1920 and 2020 and found reductions of about 4–5 % per decade in the southern Alps and about 2.3 % per decade in the northern Alpine region. Olefs et al. (2021) found a consistent decrease in SD across Austria of about 3 cm per decade on average and a decrease in SCD of about 7 days per decade in the period 1961–2020 (see also Figure 1.9: Gray bars, for the change within the last 30 years). In an alpine-wide analysis for the period 1971–2019, Matiu et al. (2021) found negative trends in all snow indicators below 2,000 m a.s.l., e.g., a decrease in SCD of about 5 days per decade. Marty et al. (2017b, 2023) analyzed long-term SWE time series in several Alpine countries, including Austria, and found, e.g., trends in the date of end of snow cover of about -3 days per decade in the period 1957–2022. Vorkauf et al. (2021) found earlier snowmelt dates of -2.8 days per decade between 1958 and 2019, which is consistent with the SCD trends noted above. In general, most studies find stronger changes in spring (earlier melting) than in fall (later onset of snow cover). In summary, estimates for recent changes in snow cover duration (SCD) in Austria and the entire Alpine region range from about -5 to -10 days per decade.
Future snow depth and snow cover duration
There are few studies on future snow conditions in Austria. Earlier studies for neighboring regions include Marty et al. (2017a, 2017b, 2023), who analyzed two catchments in the Swiss Alps and found that a decrease in SCD of about 10 days per decade can be expected at an elevation of about 1,500 m a.s.l. by the end of the 21st century, assuming the A2 scenario. In an early Austrian case study for a ski resort in Styria, Marke et al. (2014) found a decrease in SCD of 5 to 6 days per decade in the first half of the 21st century, assuming the A1B scenario. Frei et al. (2018) found an area-averaged decrease in snowfall over the Alps of about 25 % for the RCP4.5 scenario and 45 % for the RCP8.5 scenario. Matiu and Hanzer (2022) found an overall reduction in snow cover fraction of 14 % for RCP2.6 and 48 % for RCP8.5 for 2071–2100 compared to 2001–2020. Le Roux et al. (2023) projected snowfall extremes in the French Alps and concluded that annual maxima of daily snowfall are expected to decrease below 3,000 m a.s.l., but even increase above 3,600 m a.s.l. in the second half of the 21st century under the RCP8.5 scenario. Kotlarski et al. (2023) analyzed the loss of snow water equivalent (SWE) in the Alps and found, e.g., a reduction of about 20 % in the low-end scenario RCP2.6 and 80 to 90 % in the high-end scenario RCP8.5 at altitudes below 500 m a.s.l. by the end of the 21st century. Recently, a set of snow cover scenarios based on observations and the regional, bias-adjusted ÖKS15 climate simulations was published for Austria (Project FuSE-AT) (Koch, 2021b), used as a basis for climate change impact studies (e.g., Kiem et al., 2024) and expert opinions in the winter tourism sector.3 Figure 1.9 shows the estimates of SCD averaged over Austria at different elevation levels based on the FuSE-AT results. From the previous (1961–1990) to the current climate normal period (1991–2020), SCD decreased significantly at all elevation levels, on average by about 7 days per decade (Olefs et al., 2021). By the year 2050, the SCD in Austria will most likely continue to decrease by at least 5 days per decade on average. With respect to the GWLs, we expect a further decrease of the SCD by 10 to 15 days at GWL 2.0°C, by 35 to 45 days at GWL 3.0°C, and by 60 to 80 days at GWL 4.0°C. This estimate applies for all except for the lowest elevations, where the current SCD is already shorter than the projected changes for higher elevations.
Examples are given at fuse-at.ccca.ac.at
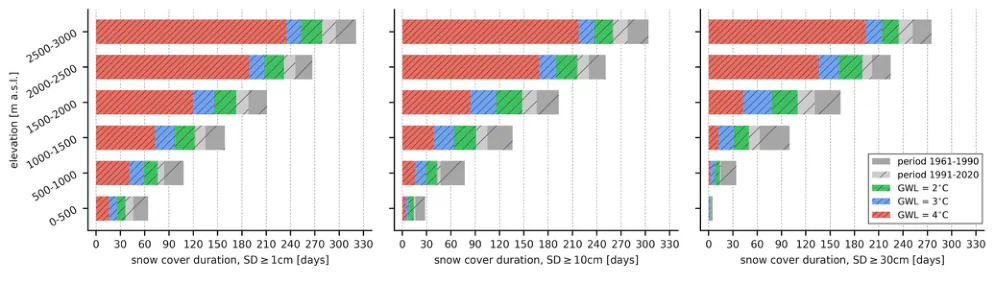
Related consequences
Feedback on radiative forcing: Kiem et al. (2024) showed that the additional radiative forcing due to decreasing albedo caused by snow cover retreat within 80 years (2021–2100) corresponds to 25–500 % (depending on emission scenario and climate model) of the radiative forcing effect of Austria’s total annual CO2eq emissions in 2021.
Natural hazards: Snow is associated with a number of natural hazards, including droughts (Sections 1.2, 1.4.3), floods (Section 1.4.1), wildfires (Cross-Chapter Box 1), and snow avalanches (Sections 2.2.1, 7.4.1).
Winter tourism and recreation (see also Sections 2.2.1 and 4.7.2): The FuSE-AT project assessed the meteorological conditions necessary for the production of technical snow (Koch, 2021a). Over two consecutive 30-year periods (1991–2020 vs. mid-century 2021–2050), the number of hours in December (a critical period for base snowmaking) with favorable conditions for technical snow production is estimated to decrease by 10–15 % at 1,000 m and 5–10 % at 2,000 m a.s.l.
Cross-Chapter Box 1. Evaluation of climate-related risks and key risks
Sven Fuchs; Birgit Bednar-Friedl; Herbert Formayer; Katharina Gangl; Veronika Gaube; Susanne Hanger-Kopp; Margreth Keiler; Stefan Kienberger; Sarah Haider-Nash; Stefanie Peer; Thomas Schinko; Jan Steinhauser
This box provides an overview of the concepts used to derive risks and key risks relevant to the AAR2 and builds on the concepts and terminology used in recent IPCC reports (Garschagen et al., 2019; IPCC, 2022b). Burning ember diagrams of key risks for Austria are provided. Key terms used for risk assessment in the AAR2 are listed in the glossary, which is based on IPCC (2022a). Further details on the used approach are provided in the 1.A.3.
The nature of climate-related risk
Throughout the chapters of the AAR2, risk provides a framework for understanding the potentially severe impacts of climate change on ecosystems and the human system, and how adverse consequences can be reduced for the future. Risk – defined as the potential for adverse consequences – results from the interaction of vulnerability (of the affected system), its exposure over time (to the hazard), and the (climate-related) hazard and the likelihood of its occurrence (CCBox 1 Figure 1). Impacts are the consequences of realized (materialized) risks on natural and human systems, such as observed losses and damage related to hazard events.
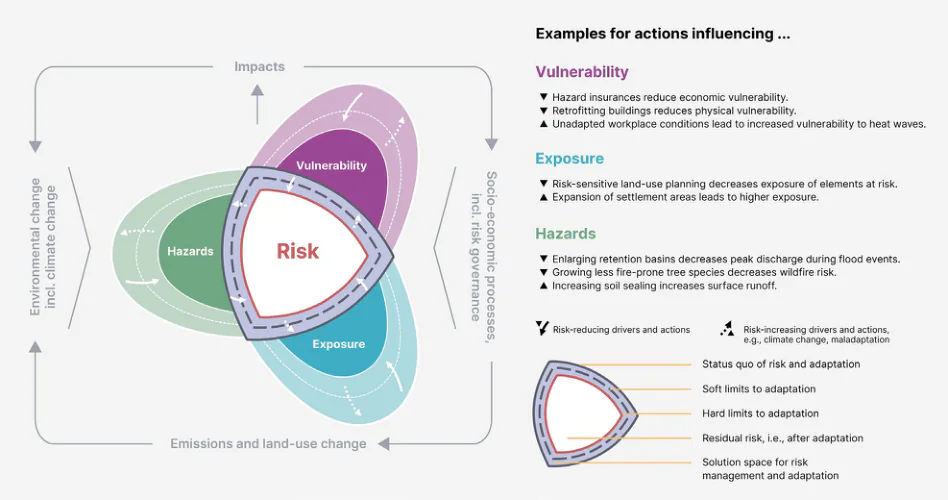
Text of the graphic
Impacts
Vulnerability
Risk
Hazards
Exposure
Environmental change incl. climate change
Socio-economic processes, incl. risk governance
Emissions and land-use change
Examples for actions influencing ...
Vulnerability
Hazard insurances reduce economic vulnerability.
Retrofitting buildings reduces physical vulnerability.
Unadapted workplace conditions lead to increased vulnerability to heat waves.
Exposure
Risk-sensitive land-use planning decreases exposure of elements at risk.
Expansion of settlement areas leads to higher exposure.
Hazards
Enlarging retention basins decreases peak discharge during flood events.
Growing less fire-prone tree species decreases wildfire risk.
Increasing soil sealing increases surface runoff.
Risk-reducing drivers and actions
Risk-increasing drivers and actions, e.g., climate change, maladaptation
Status quo of risk and adaptation
Soft limits to adaptation
Hard limits to adaptation
Residual risk, i.e., after adaptation
Solution space for risk management and adaptation
The AAR2 assessment recognizes the complex nature of climate-related risks by addressing changes in hazard, exposure and vulnerability, including feedback and possible cascading processes of overall ecosystem and anthroposphere impacts. Hazard, exposure and vulnerability may each be subject to uncertainty and may vary in time and space due to socio-economic dynamics and human decision-making. Thus, risk may increase or decrease over time in relation to the dynamic interactions between the three risk components, which in turn may increase or decrease over time. Adaptation and risk management play an important role in reducing the overall risk associated with climate change. However, there are also limits to adaptation due to hard limits (no adaptive action is possible to avoid intolerable risks) or soft limits (options may exist but are not currently available to avoid intolerable risks through adaptive action) that will result in increasing losses and damages. The remaining solution space (CCBox 1 Figure 1) includes options for strategies and measures that are available and appropriate to address climate risks.
Climate-related risks as assessed in this report
Our understanding of climate-related risks is based on multiple and diverse sources of information, including climate change science, natural sciences, engineering, social sciences, and economics. The standardized workflow for climate-related risk assessment in Austria is based on the corresponding IPCC framework and workflow (IPCC, 2022b: Chapter 16). Following the structure of the AAR2, the assessment of climate-related risks and the identification of key risks are organized in a cross-chapter approach. Chapter 1 provided information on climate change, climate-related hazards and ecosystem impacts (see Table 1.A.4). Based on the information provided in Chapter 1, Chapter 2, Chapter 3, Chapter 4 and Chapter 7, we evaluated the observed impacts within their respective subsystems and assessed the future evolution of climate-related risks, shaped by changes in climate-related hazards as well as exposure and vulnerability. These risks were further evaluated through the filters of severity and urgency to identify and describe Austria’s key risks. While some key risks may already reflect dangerous disruptions today, they may typically become more severe over time due to changes in the nature of the hazards and/or the exposure/vulnerability of societies or ecosystems to these hazards. They may also become severe due to the adverse consequences of adaptation or mitigation responses to the risk. Key risks are identified as potentially urgent to determine the priority for action with different adaptation/risk management strategies according to (societal) risk preference/tolerance and soft/hard adaptation limits to be crossed. In the next step, these results were assessed in Chapter 5 and Chapter 6, taking into account the needs in the context of societal adaptation options and from a governance perspective, and fed into Chapter 8.
Resulting climate-related key risks for Austria
Rising temperatures lead to health risks, especially in urban areas and to reduced labor productivity: Increasing frequency and duration of heat waves, including tropical nights, pose a risk to human health, especially for people living in urban areas and those exposed to heat in their working environment (high confidence). A GWL 4.0°C leads to an increase in the number of hot days (>30°C) from 25 to 60 per year in the hottest regions of Austria (see CCBox 1 Figure 2). Potential impacts include an increase in heat-related morbidity and mortality, a decrease in quality of life, out-migration, and a decrease in labor productivity, resulting in economic losses for various economic sectors and households. Heat exposure is greatest in densely populated urban areas because their natural cooling capacity is reduced by a lack of open and green spaces and often limited building quality. Work-related heat impacts are higher for those who perform physical work outdoors or work in non-air-conditioned indoor environments. Individuals in the low and high age groups, and especially those with lower socio-economic status or chronic illnesses, are particularly vulnerable to extremely high temperatures. Possible adaptation options to address heat exposure include increasing green and shaded areas or technical solutions for cooling. In the working environment, adaptation options include providing air conditioning at workplaces or, if this is not possible, shifting working hours to cooler times of the day, reducing working hours, increasing breaks and ensuring health recovery and relaxation during breaks (Cross-Chapter Box 2 and Sections 3.2 and 4.4.3).
The risk of drought will increase in Austria: Increasing evapotranspiration and precipitation variability will increase the risk of droughts seasonally and regionally. This will considerably increase the uncertainty of agricultural production (quantity and quality of certain profitable crops) and severely affect highly vulnerable ecosystems, leading to potentially irreversible losses (medium evidence, high agreement). As a result, agricultural irrigation needs will increase, especially in eastern Austria, which may further degrade fragile ecosystems, associated biodiversity, and other sectoral water needs. This may also lead to more frequent water shortages (limited evidence, high agreement). Households, businesses and services that depend on water availability in these regions will be more likely to experience water scarcity. Possible adaptation measures include adapted crop rotations (including drought-tolerant crops), sustainable soil management, a networked expansion of water supply, the use of rainwater for irrigation and water-saving production (see Sections 1.2.2, 1.6, 1.8 and 2.2.1).
Risk of pluvial and river flooding will increase in Austria: There is evidence that pluvial floods, and to some extent river floods, will become more frequent and more intense in Austria (medium confidence). This will affect communities by causing major economic losses, especially those that expand their built environment. In particular, areas with a high degree of surface sealing are vulnerable to pluvial flooding. In addition, floods affect transport infrastructure and services, and thus the mobility of the population and the accessibility of communities, and can interrupt pan-European transport routes. The elements at risk have different (physical) vulnerabilities to flood processes. Social and economic aspects of vulnerability can increase the overall susceptibility. A lack of (compulsory) building insurance is the bottleneck of economic vulnerability. Strengthening and implementing spatial planning, unsealing urban and rural areas, efficient rainwater drainage in urban areas and upgrading drainage infrastructure are effective adaptation tools for both fluvial and pluvial floods. Further improvements in monitoring systems could improve warning and preparedness (see Sections 1.4, 1.8, 3.2.3 and 7.4.1).
The risk of torrential floods will increase in Austrian mountain valleys: In the Alpine region, torrential floods will become more frequent and more intense in the future (robust evidence, medium agreement), driven by an increase in intense precipitation events and in catchments with increased sediment availability. Sediment availability is expected to increase at high elevations where (i) glacier retreat, (ii) permafrost degradation and (iii) increased physical weathering occur. Torrential floods and related cascading events will affect alpine communities at local and regional levels, causing significant economic losses, especially as the built environment and land use expand. They will also affect transport infrastructure and services, thus affecting population mobility and the accessibility of mountain communities and economics, and may disrupt pan-European transport routes. The trend in torrential events is also strongly related to risk management, as financial resources for maintaining existing technical protection are limited. Therefore, current measures could be complemented by a portfolio of adaptation options to reduce the risk of torrential floods, such as enforcement of land use regulations, mandatory building insurance, pooled prevention funds to also encourage non-governmental investment in local (property) protection (see Sections 1.4, 1.8 and 7.4.1).
The risk of wildfire will increase in Austria: The effects of climate change are expected to lead to an increase in heat waves and changes in precipitation patterns and thus to an increase in fire weather days, which will ultimately increase the risk of wildfire in Austria (high confidence). This will affect local communities through economic losses, especially as the built environment and land use expand and the wildland-urban interface increases. It will also affect transportation infrastructure and services, thus affecting population mobility and accessibility of communities, and may disrupt pan-European transportation routes (especially railways). In addition, wildfires are a source of massive increases in health-threatening particulate matter, both locally and along wind paths. Wildfire-adapted assets and fire-resistant vegetation may be less vulnerable depending on the type of wildfire. Adaptation includes shifting to less fire-prone tree species (e.g., hardwoods) and organizational preparedness. Furthermore, information and awareness-raising of the population are important, as about 85 % of forest fires in Austria are directly or indirectly caused by human activities. With regard to the residual risk, the agricultural and forestry sector can be compensated by insurance (e.g., hail insurance/Hagelversicherung), and some damage to the built environment can be compensated by insurers (see Sections 1.7, 2.2.2 and 7.4.1).
Risk of decreasing quantity and quality of protection forests: Rising air temperatures and more frequent and severe droughts will lead to shifts in tree species distribution and forest composition, which may have negative consequences for the protective function of forests at elevations <1,000 m a.s.l. In parallel with the dynamics of natural forest disturbances, e.g., by wind, fire, pests and insects, their protective function will decrease at higher elevations, e.g., during the ongoing unprecedented bark beetle outbreak in Austria (high confidence). Monocultures are more susceptible to disturbances and thus more exposed to wind, fire, pests and insects than mixed stands. Tangible and intangible losses to infrastructure, buildings, and human lives can result from the increased hazard potential downslope of a degenerated protective forest. Furthermore, secondary hazards (such as snow avalanches and debris flows) may develop on affected areas, and soil loss and increased surface runoff may be observed. These secondary effects may eventually pose existential risks to exposed communities in the valleys below, requiring transformative risk management measures such as planned resettlement. Post-disturbance management decisions can have an important impact on protection. If left in the stand, deadwood could maintain the protective function of forests after windthrow and bark beetle disturbances, especially during the first 15 years. To better adapt to these threats, uneven and multi-layered stands with trees of all sizes and age classes, a minimum canopy cover of about 40 %, only small openings and a sufficient presence of natural regeneration should be considered (see Sections 1.6.2, 2.2.2 and 7.4.2).
Risk of biodiversity loss: There is evidence of upward migration of mountain species due to warmer conditions. Therefore, cold environments above the tree line will shrink and this will lead to biodiversity loss. Long-ranged, warm-demanding species will replace short-ranged, cold-adapted species (some of them endemic, restricted to the Austrian Alps), especially at elevations >2,600 m a.s.l. There is an increasing risk of mismatched interactions between organism groups (e.g., plants and pollinators) and physiological stress of high-elevation species due to warming. Furthermore, weakening of tree vitality and increased susceptibility to bark beetles can be expected, leading to a reduction in the protective function of forests. The magnitude and likelihood of adverse consequences are high due to the pervasiveness of impacts across the Austrian Alps. There is a high potential for irreversible consequences due to the loss of intraspecific genetic diversity prior to eventual extinction. Although the likelihood is high, the effects will only become manifest in the coming decades because many alpine plants are long-lived species, and some may persist even when habitat conditions are no longer suitable. The lack of awareness of the many cascading effects of biodiversity loss leads to a lack of public attention. There is an increasing need for nature conservation in many alpine areas to avoid additional pressures from human land use (see Sections 1.6.4, 2.2.2 and 7.4.1).
The increasing risk to the infrastructure of the energy system limits Austria’s energy security: Increasing electrification and thus grid-connected energy infrastructure threatened by climate-related extreme events pose an increasing risk to energy security (high confidence). Potential impacts include damage to energy generation (PV panels, wind turbines) and transmission infrastructure (overhead power lines, pipelines), resulting in energy supply disruptions to households, industry and infrastructure. Thermal generation units are will also be affected due to increased cooling demand and efficiency losses due to higher temperatures. Climate change impacts on energy demand, supply and infrastructure can lead to cascading effects and large-scale disruptions due to the high degree of interconnectedness between the energy system and all components of modern societies. Long investment cycles in energy infrastructure assets require early adaptation of planning, construction and operation to avoid lock-in effects. Possible adaptation measures to address this risk include designing energy infrastructure assets more climate-resilient, diversifying energy supply sources, increasing the degree of interconnection of European energy systems, decentralization, and climate-adapted network planning (see Section 4.5.1).
Increasing risk of power shortage due to compound weather events: Compound weather events, such as Europe-wide cold spells in winter combined with low river discharge, lead to high energy demand and low energy production in a highly electrified and renewables-based energy system, resulting in power shortages (high confidence). Fluctuations in demand and supply due to compound events may further threaten the stability of the electricity system. Coupled with an expected shift in electricity load towards summer months (increased cooling demand), power shortages will be exacerbated and economic losses and costs may occur due to the need for balancing energy and/or higher electricity prices. Possible adaptation measures include increasing the degree of interconnection of the European energy system, reducing energy and cooling water demand, increasing back-up capacities, spatial and technological diversification of energy sources and flexibility options (see Section 4.5.1).
Climate change leads to a loss of competitiveness in the Austrian tourism industry (snow and ice sports): Decreased snowfall and snow cover at lower altitudes due to rising temperatures, together with deteriorating conditions for technical snow production, will lead to a loss of competitiveness in snow- and ice-related tourism activities (high confidence). The natural snow season has decreased by an average of 7 days per decade (1961–1990 vs. 1991–2020) and will continue to decrease by 60–80 days (GWL 4.0°C). There is strong evidence that winter tourism based on snow and ice sports will be severely affected by shortening ski seasons and deteriorating snowmaking conditions. Households, businesses, and services in lower elevation ski resorts will be particularly affected. The high dependence of local economies on snow and ice sports and the lack of economic alternatives will increase the economic and social vulnerability of Austria’s mountain regions. The associated loss of jobs in regions dependent on winter tourism will increase commuting and out-migration. Opportunities for adaptation and transition include the development of and investment in snow-independent tourism (see Sections 1.3, 4.3.3, 4.3.4 and 7.4.2).
Human responses to climate-related risks can amplify or reduce the expected impacts: Disaster and crisis management plans, contingency plans for energy and natural resource shortages, or extreme weather events can limit expected impacts. Behavior-based communication and compliance strategies for management plans are critical to their effectiveness (e.g., emergency notification standards, support from societal role models, etc.). These can be built on existing risk management structures (e.g., training courses on climate impact responses as part of work safety).
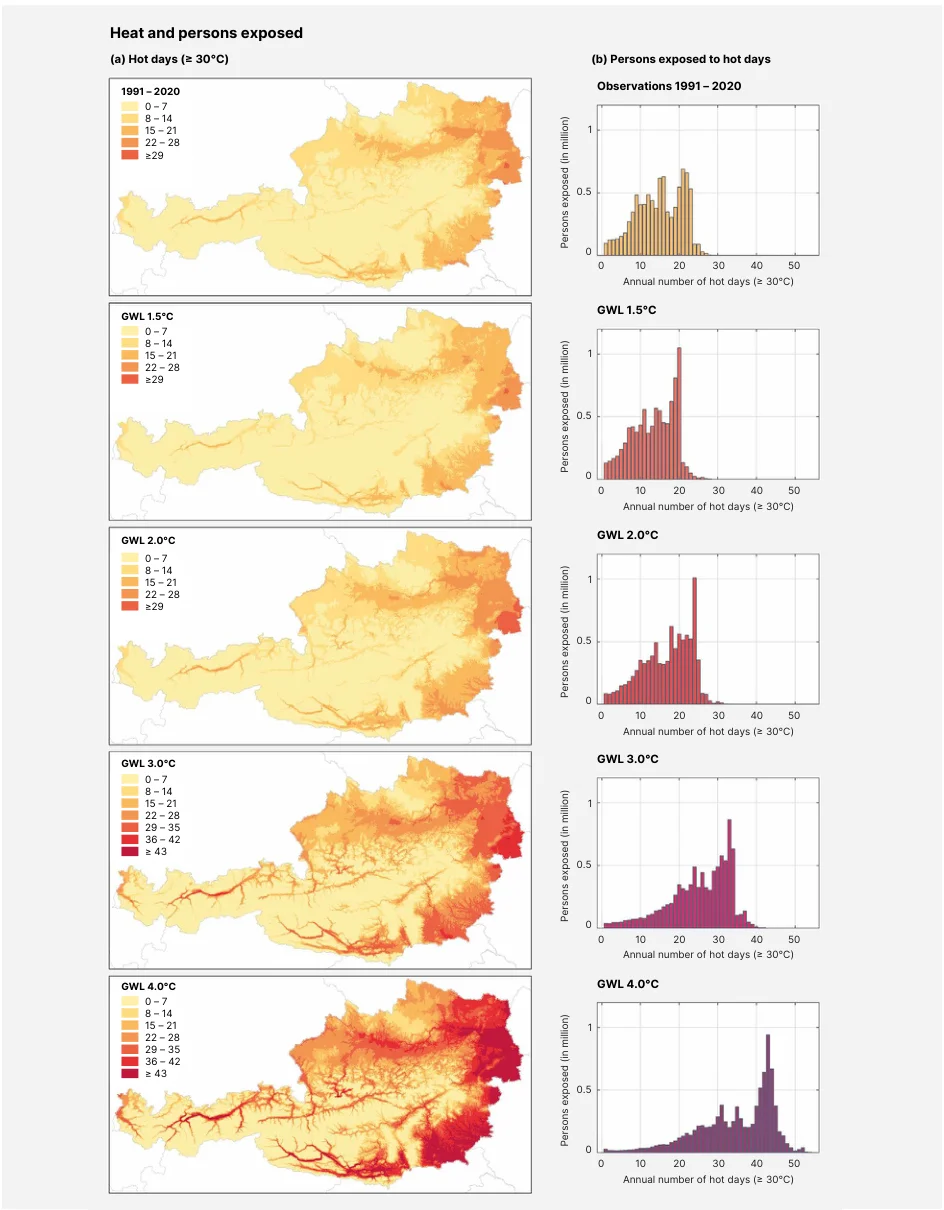
Text of the graphic
Heat and persons exposed
(a) Hot days (≥ 30°C)
1991 – 2020: 0 – 7, 8 – 14, 15 – 21, 22 – 28, ≥29
GWL 1.5°C: 0 – 7, 8 – 14, 15 – 21, 22 – 28, ≥29
GWL 2.0°C: 0 – 7, 8 – 14, 15 – 21, 22 – 28, ≥29
GWL 3.0°C: 0 – 7, 8 – 14, 15 – 21, 22 – 28, 29 – 35, 36 – 42, ≥ 43
GWL 4.0°C: 0 – 7, 8 – 14, 15 – 21, 22 – 28, 29 – 35, 36 – 42, ≥ 43
(b) Persons exposed to hot days: Observations 1991 – 2020, GWL 1.5°C, GWL 2.0°C, GWL 3.0°C, GWL 4.0°C
Persons exposed (in million): 0, 0.5, 1
Annual number of hot days (≥ 30°C): 0, 10, 20, 30, 40, 50
Austria is currently affected by climate-related damage and losses, and future climate change together with socio-economic development, will intensify these effects: Losses due to climate change (damage caused by extreme weather events as well as negative consequences of climate change) are currently estimated at an average of EUR 2 billion per year and are expected to increase to at least EUR 2.5 to 5.2 billion per year by 2030 and to EUR 4.3 to 10.8 billion per year by 2050. However, there is little quantitative evidence from Austrian studies. International studies provide some insights, but their relevance for subnational and sector-specific assessments in Austria is limited. Standardized documentation of losses is needed, and more research is needed to better quantify and provide robust figures on potential climate-related direct and indirect impacts on society, livelihoods, economic sectors and services.
Resulting burning embers for Austria
At the current GWL 1.4°C [1.2–1.6°C] in the year 2024, corresponding to a mean temperature change in Austria of 3.1°C in 2024, moderate risk levels have already been identified and attributed to climate change for a number of key risks (CCBox 1 Figure 3): Mortality due to heat; agricultural crop yield losses due to drought; ecosystem disturbances (such as changes in species numbers and composition, ecosystem functions, or range shifts); and loss and damage due to riverine, torrential, and pluvial floods. For grassland yields, water scarcity and ski tourism, moderate levels of risk have been observed in some regions (drought risk and water scarcity in some regions and some years; ski tourism at lower altitudes); these risks are projected to intensify and spread to other regions and higher altitudes (medium confidence). Most of the key risks are characterized by high risk levels around GWL 3.0°C, due to the larger areas affected by the risk and the persistence and severity of the impacts. For some key risks, such as mortality, crop and forest yields, ecosystems, water supply, and ski tourism, very high risks cannot be excluded at current levels of adaptation; however, confidence in the GWL at which the transition from high to very high risk is projected to occur is low (high agreement that the transition cannot be excluded, but low number of publications).